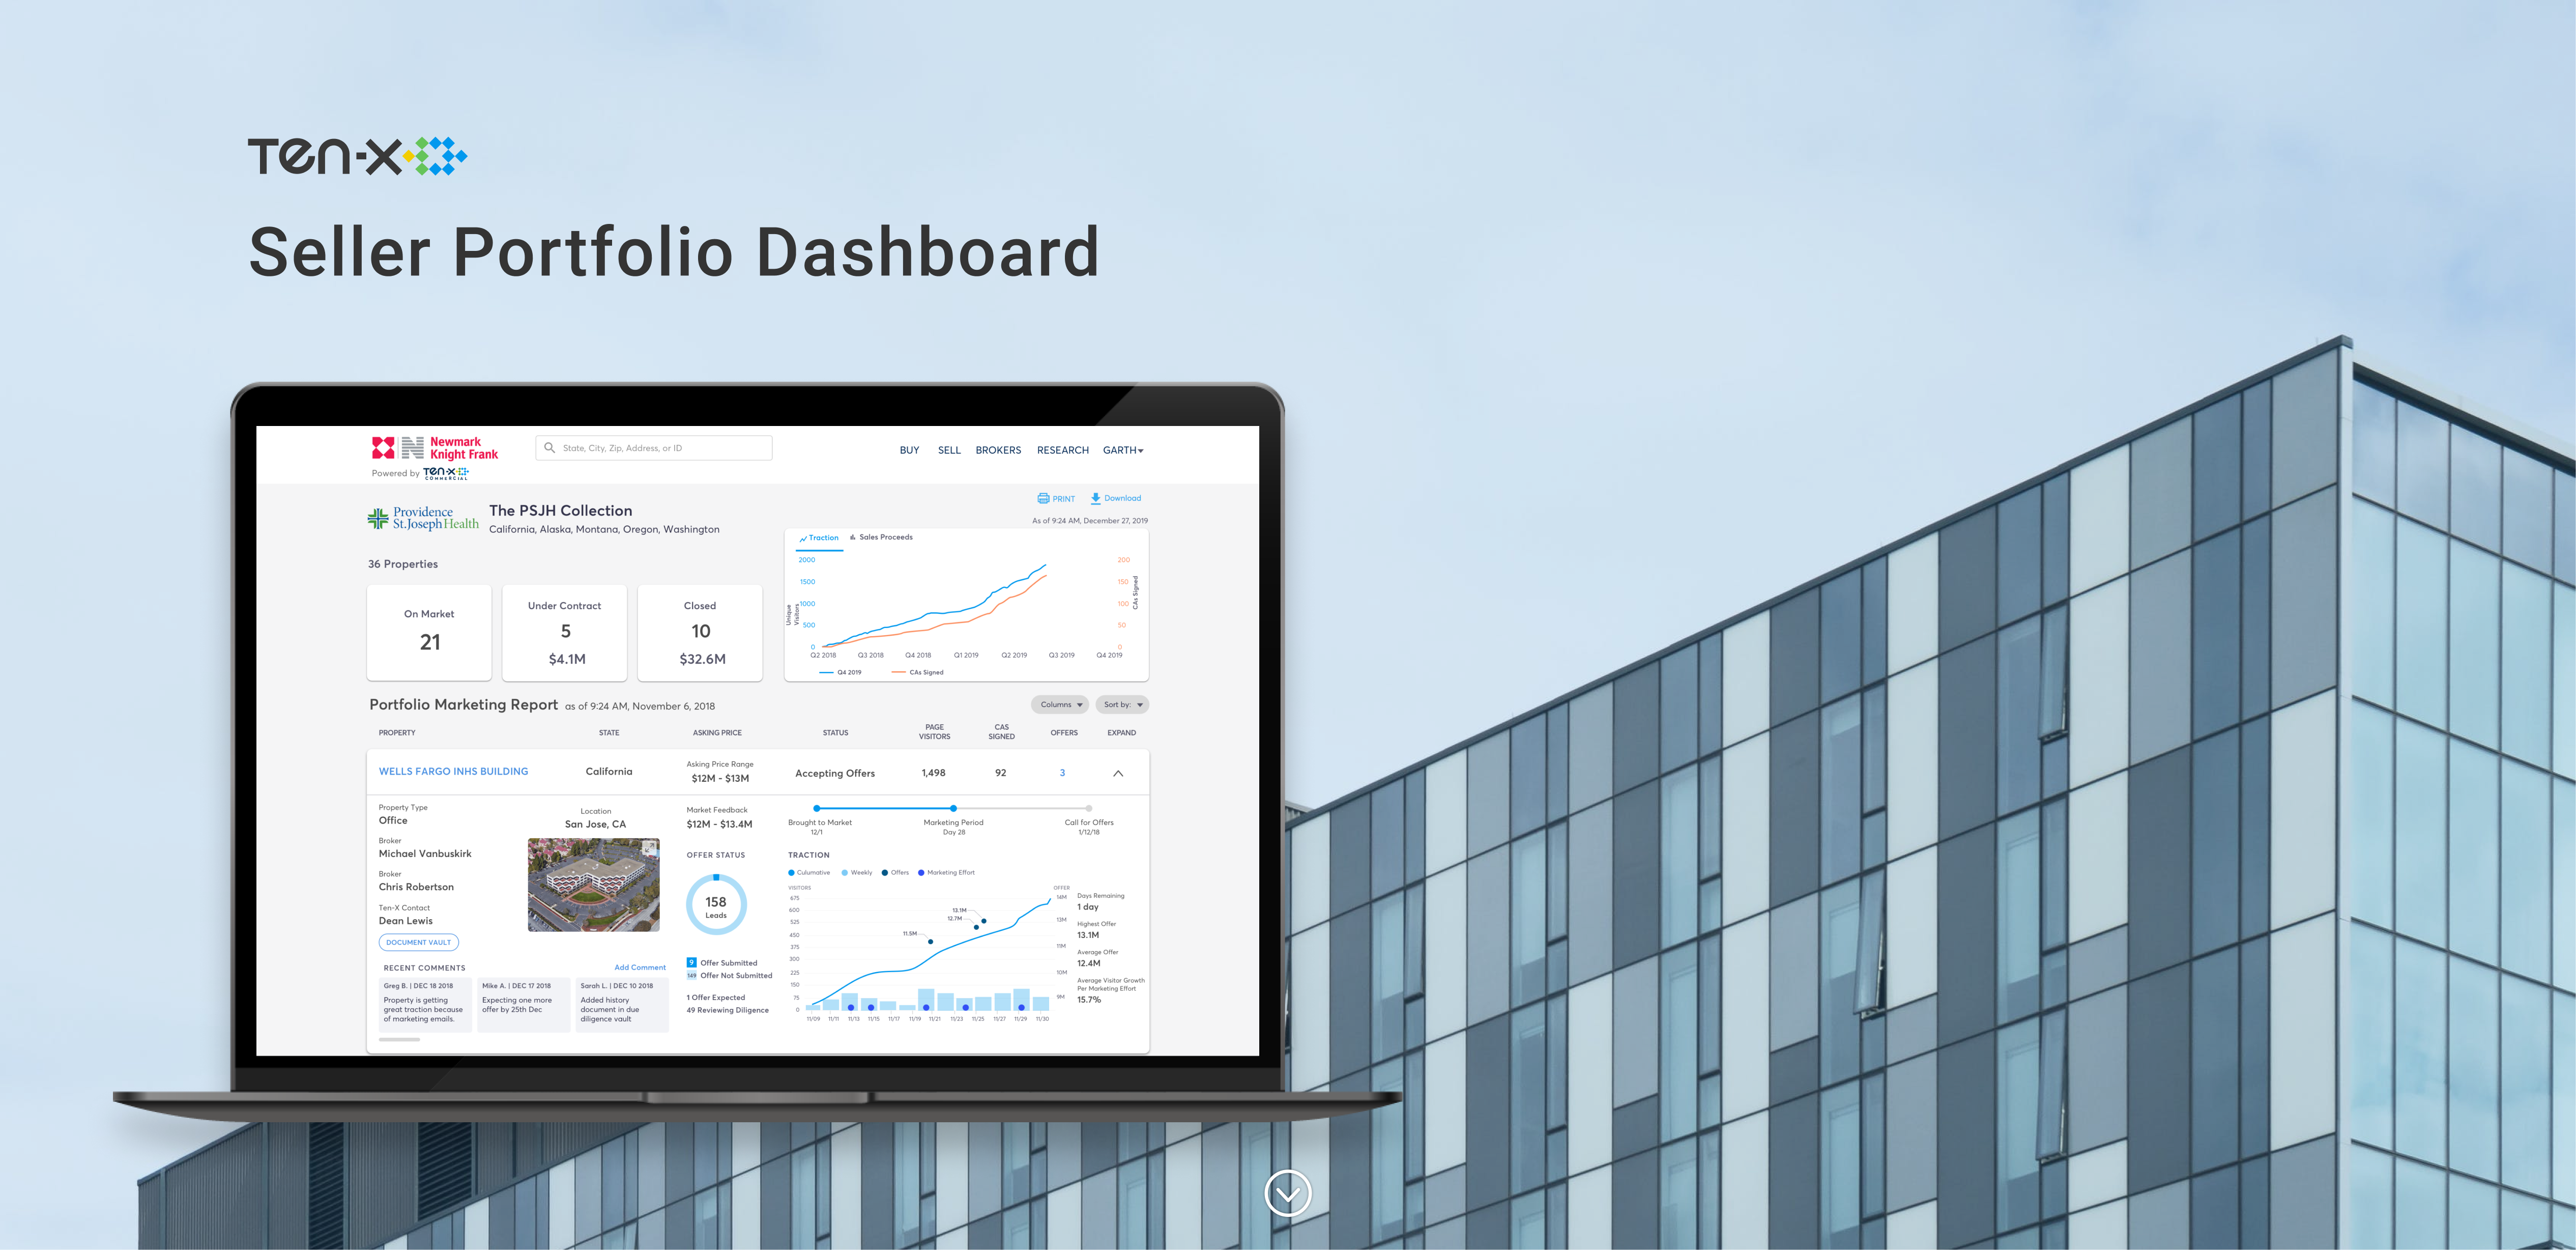
The Product
Ten-X's strategic initiatives include partnering with brokerage firms to create customer-centric product solutions. Portfolio Dashboard allows brokers to closely monitor the progress of a listing by providing insights on the marketing activity, traction, offer management, buyer interests, and closing a transaction. It allows them to make informed decisions effectively.
My Role
I was the only designer working closely with a product manager, 2 front-end developers and 2 backend developer. In addition I closely collaborated with the broker partners to define the their requirements, challenges, and opportunities. Following the iterative design process, I created several versions of high fidelity wireframes and regularly presented it to the stakeholders to get their feedback. I was concurrently working with the developers to fully leverage the Ant Design React Framework allowing us to progress rapidly on building the product.
Results
The product achieved 100% adoption rate with the portfolio brokers, thereby increasing their engagement with the Ten-X platform. Portfolio dashboard has enabled brokers to transact over $200m worth of commercial real estate asset within a span of 6 months.
Background
Special servicers are one of Ten-X's key customers bringing the majority of the revenue and inventory. Their primary goal is to expedite the sale of a large inventory of commercial real estate. Time being a critical factor it is important for them to process and analyze large amounts of data associated with the sale of each property and make a prompt decision.
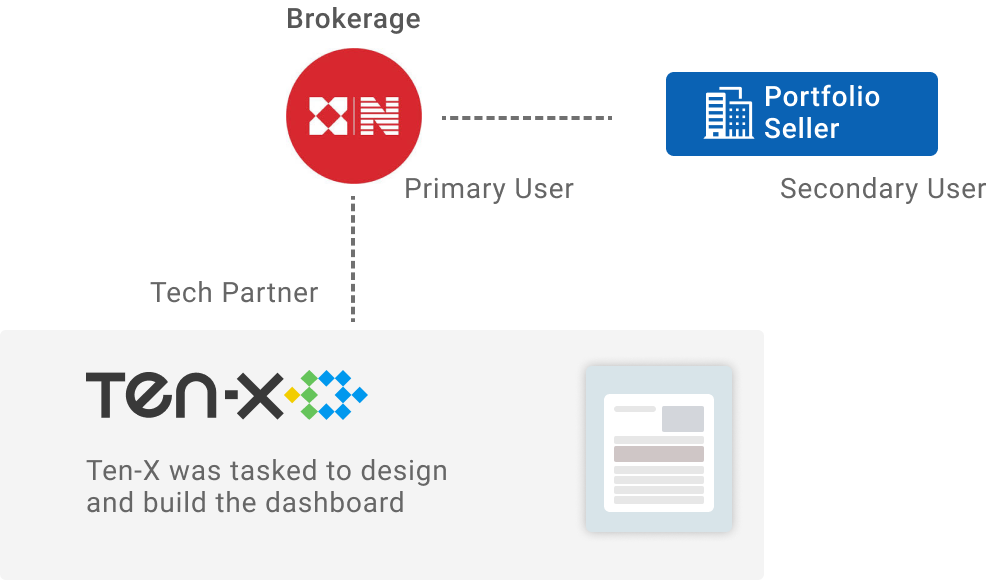
Brokerage firms assist special servicers in the sale operations. Ten-X partners with several brokerage firms to create solutions to optimize and make process savvy. Brokerage firms needed a special dashboard that keeps track of a large amount of data so they can process it and present it to their clients as needed. This is where Ten-X found the opportunity to create a unique product that will address these use cases. Simultaneously, build a product which is scalable and apply to any sale of large-scale portfolio sales.
Persona
Commercial Real Estate Broker
- Wants to stay organized and informed
- Spent most of the career using excel sheet for storing, viewing, and analyzing data
- Spends time building customer relationship and strengthening networks
- Wants to know more about the potential buyers

Broker Interviews

"Having a clear view of the properties we close every quarter and being able to report it seamlessly is crucial for our business."

"We could use more help in identifying properties that need attention in terms of marketing and promotion"
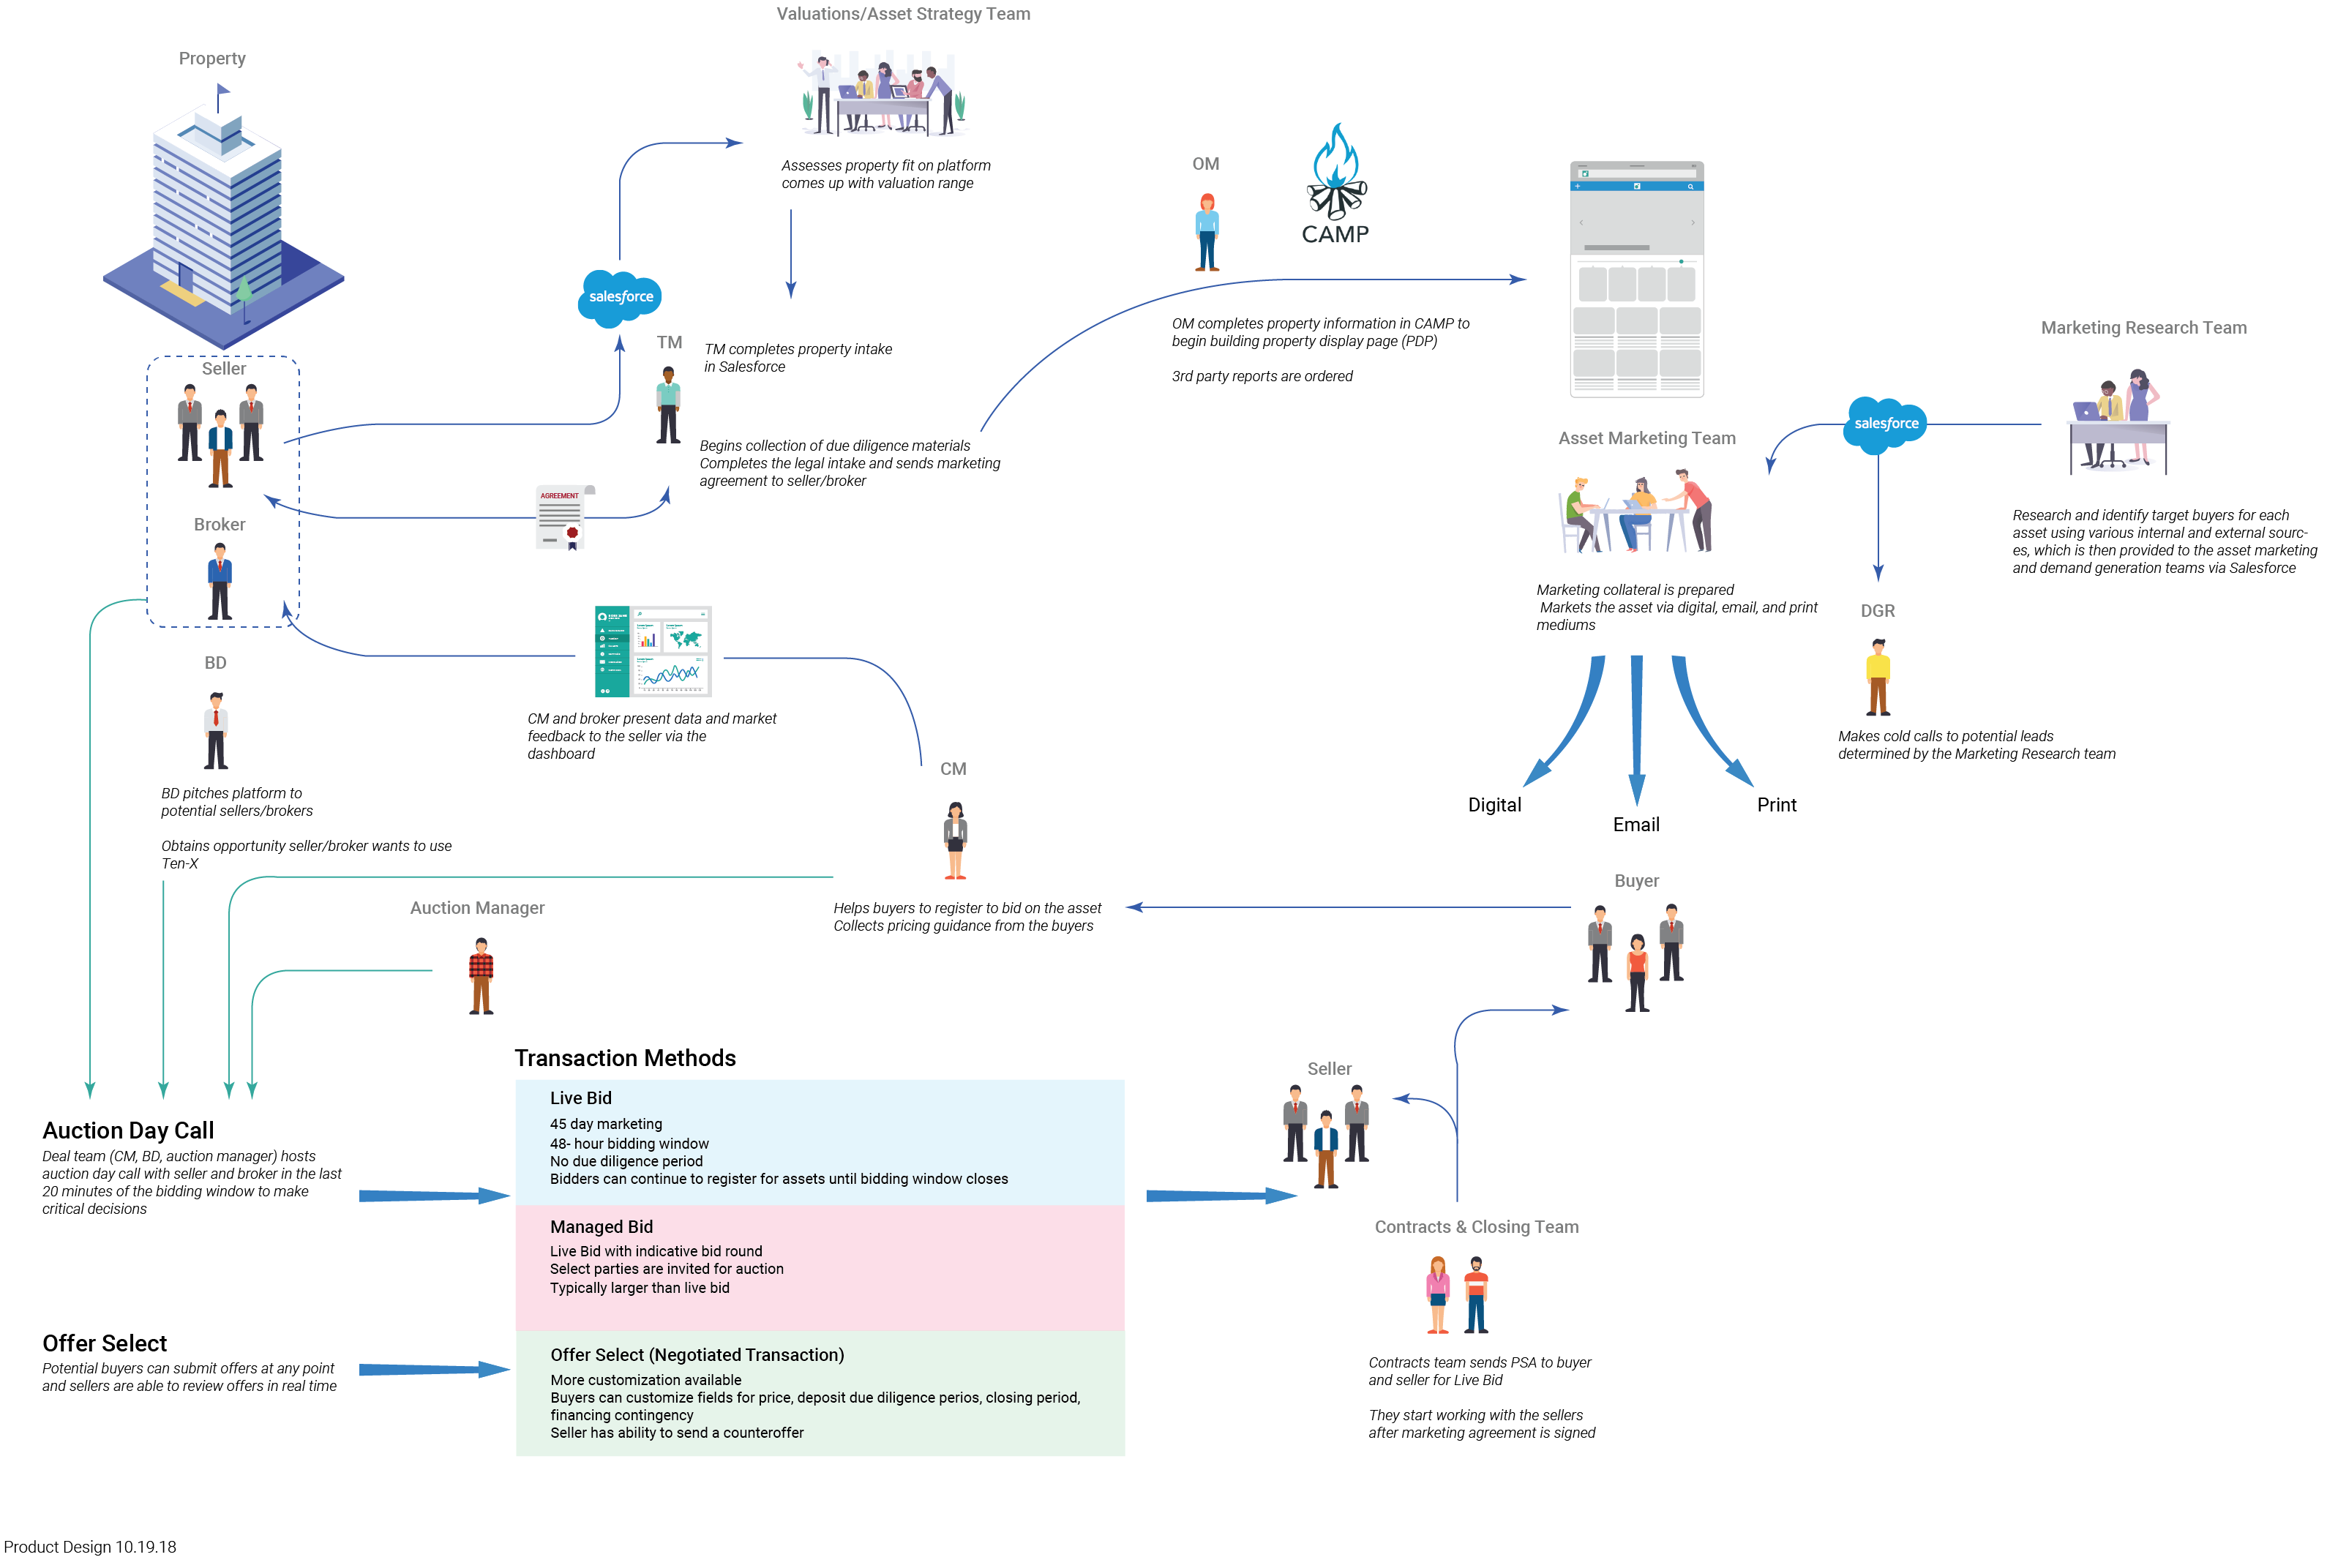
Operations Flow
Being new to the real estate industry, I had to do a quick deep dive into the subject matter and understand the entities, processes, and nuances. I observed several auction events and had conversations with the experts to begin my learning. I put together a process map of all the operations to grasp the flow.
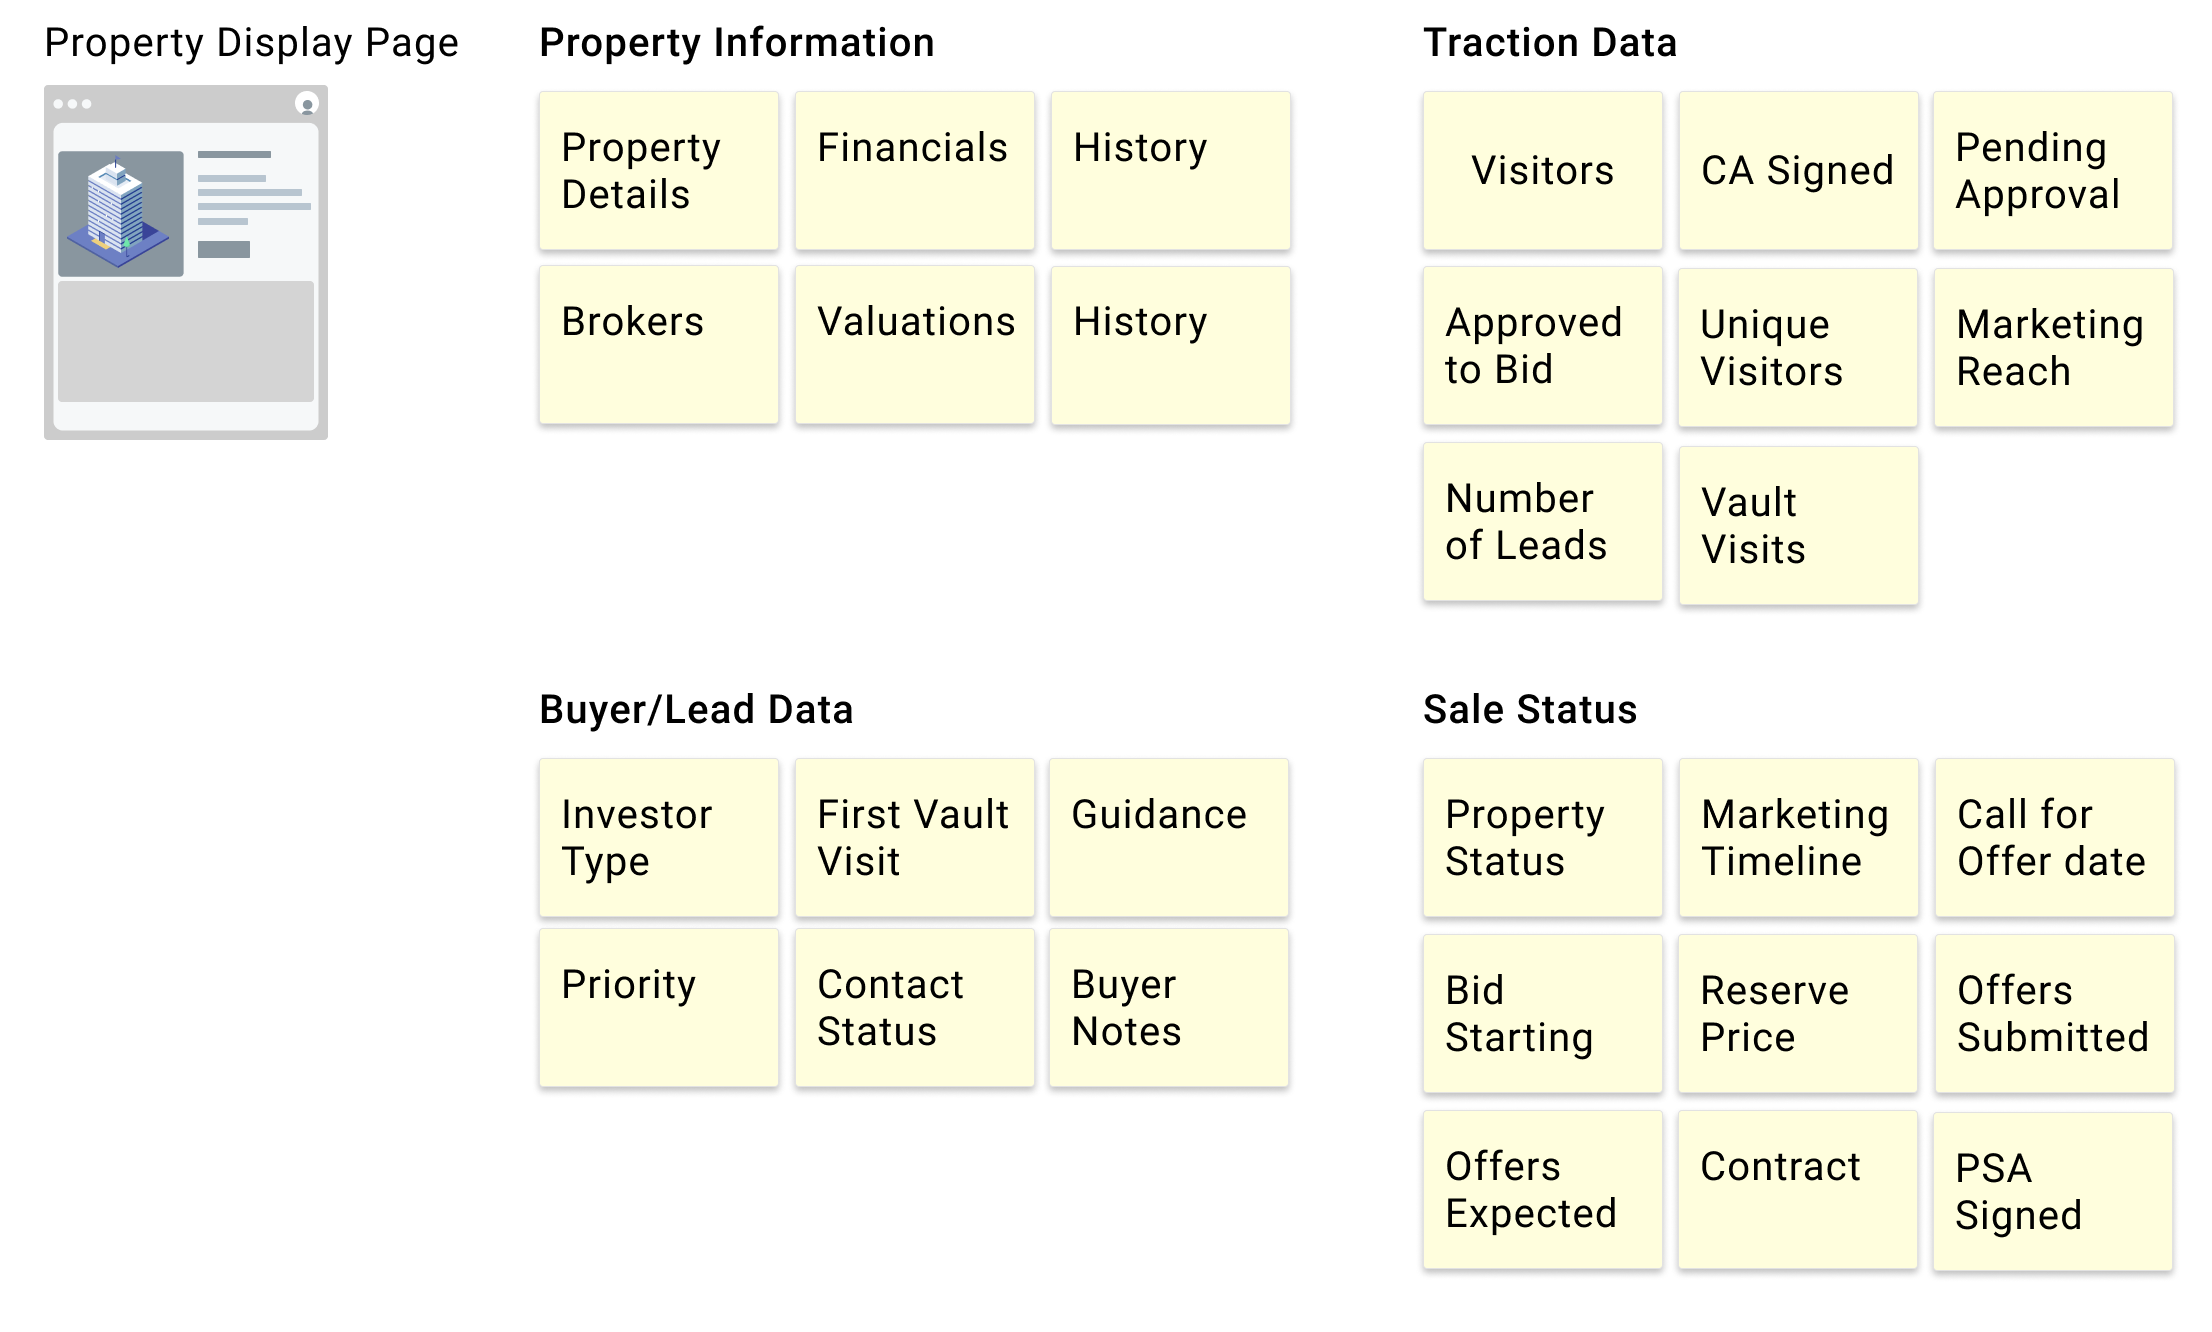
Data Gathering & Scoping
Identifying data clusters existing on Ten-X was important as it helped to scope the dashboards. My properties page was used by the sellers/buyers as a dashboard to keep track of their properties and it was logical to use it as a starting point. Another rich data source was the marketing dashboard page which tracked numerous marketing-related statistics of a listing.
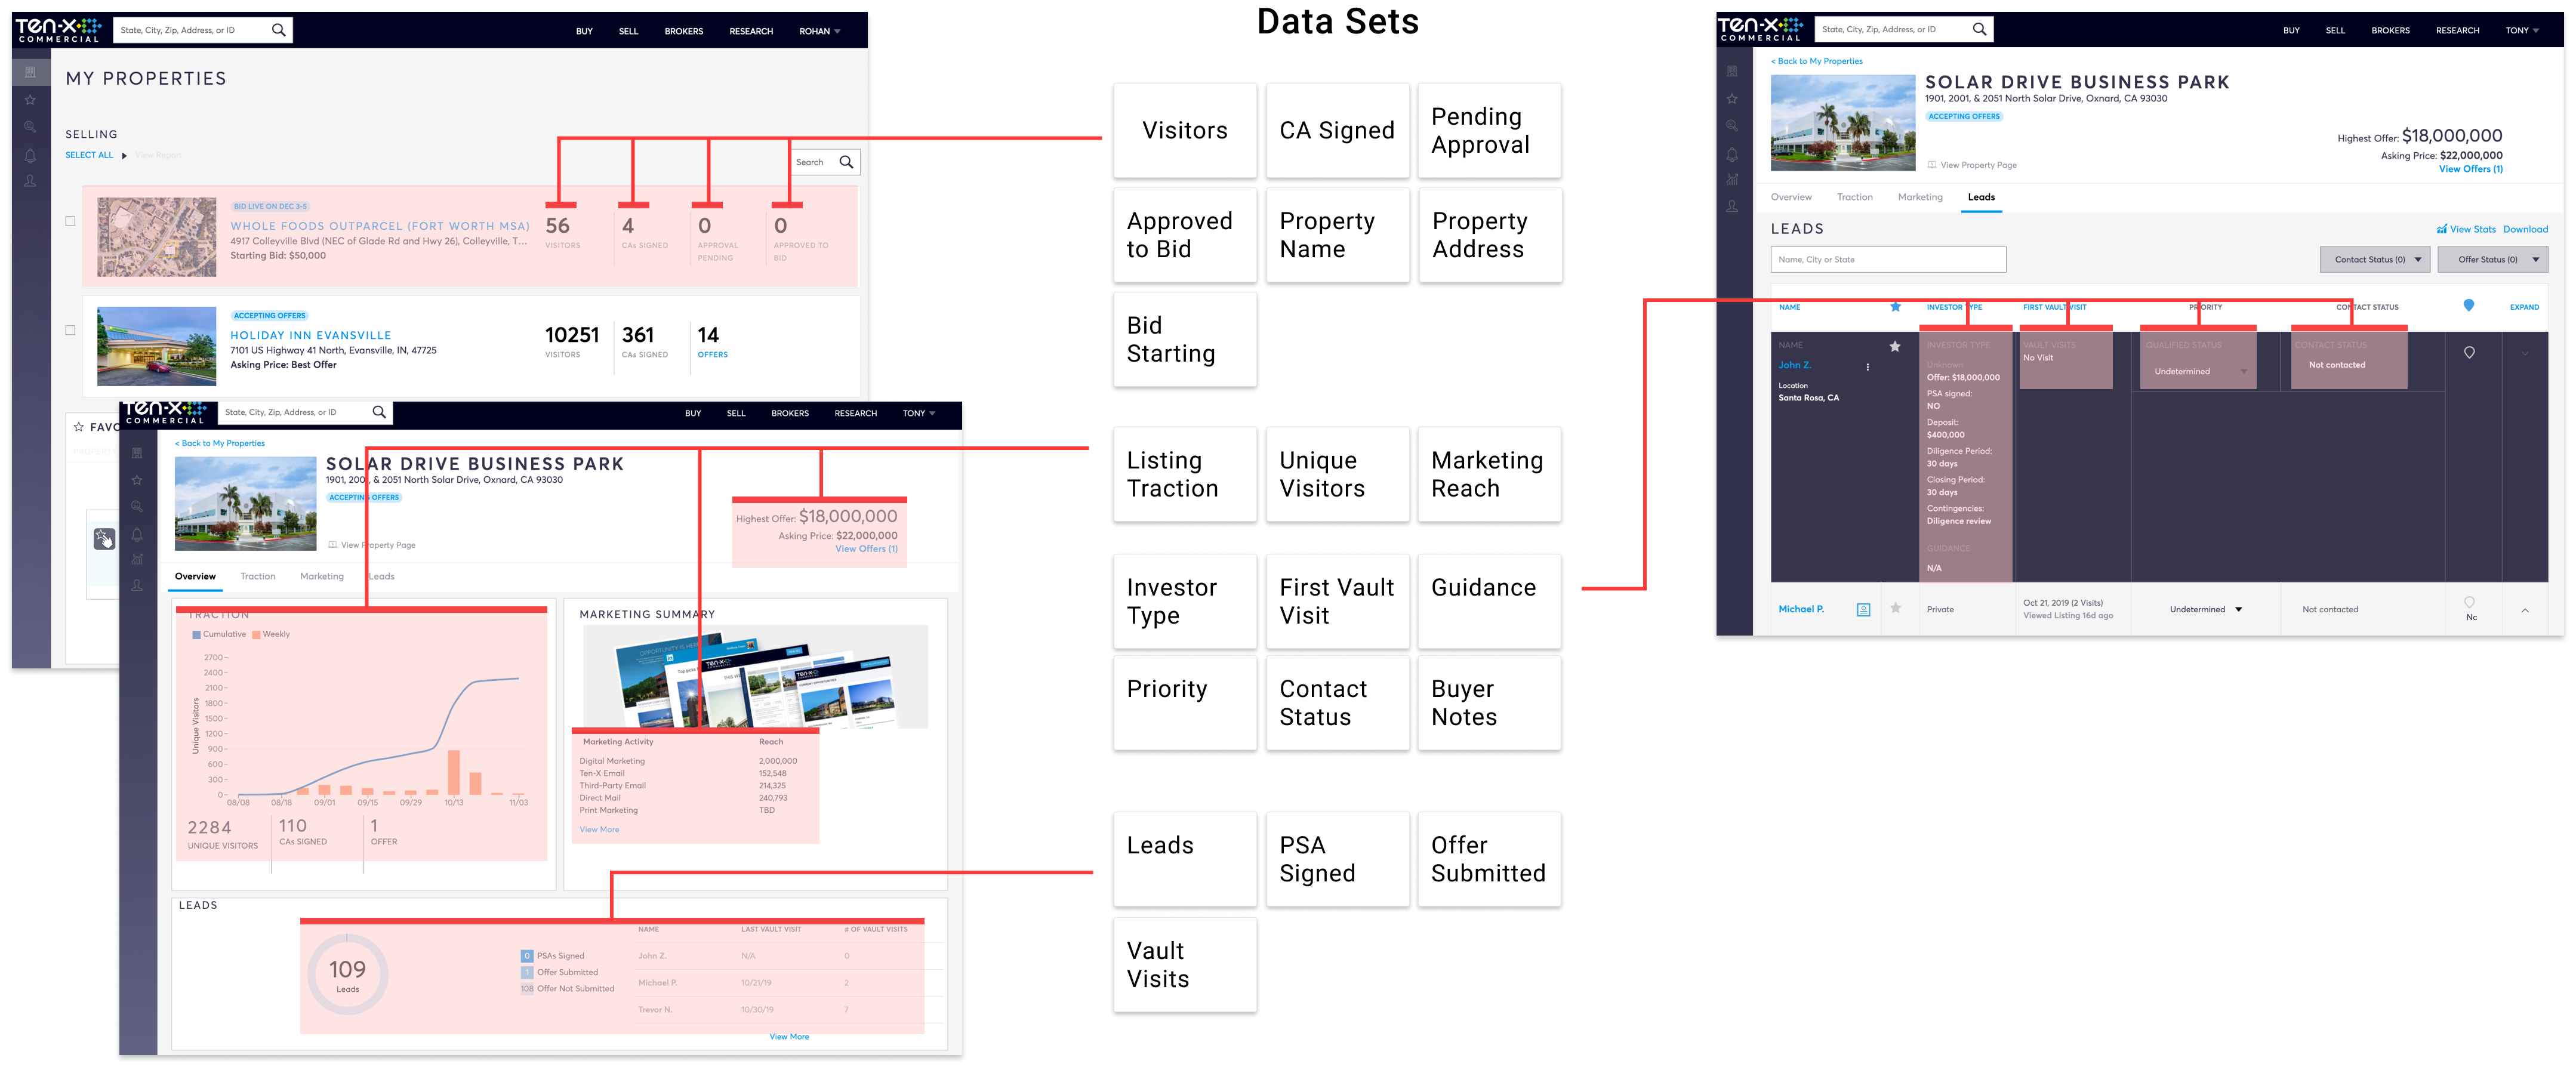
Clustering Components
After identifying the data clusters I grouped them in a logical manner to help me design and layout the components.
Lo-Fi Mockups
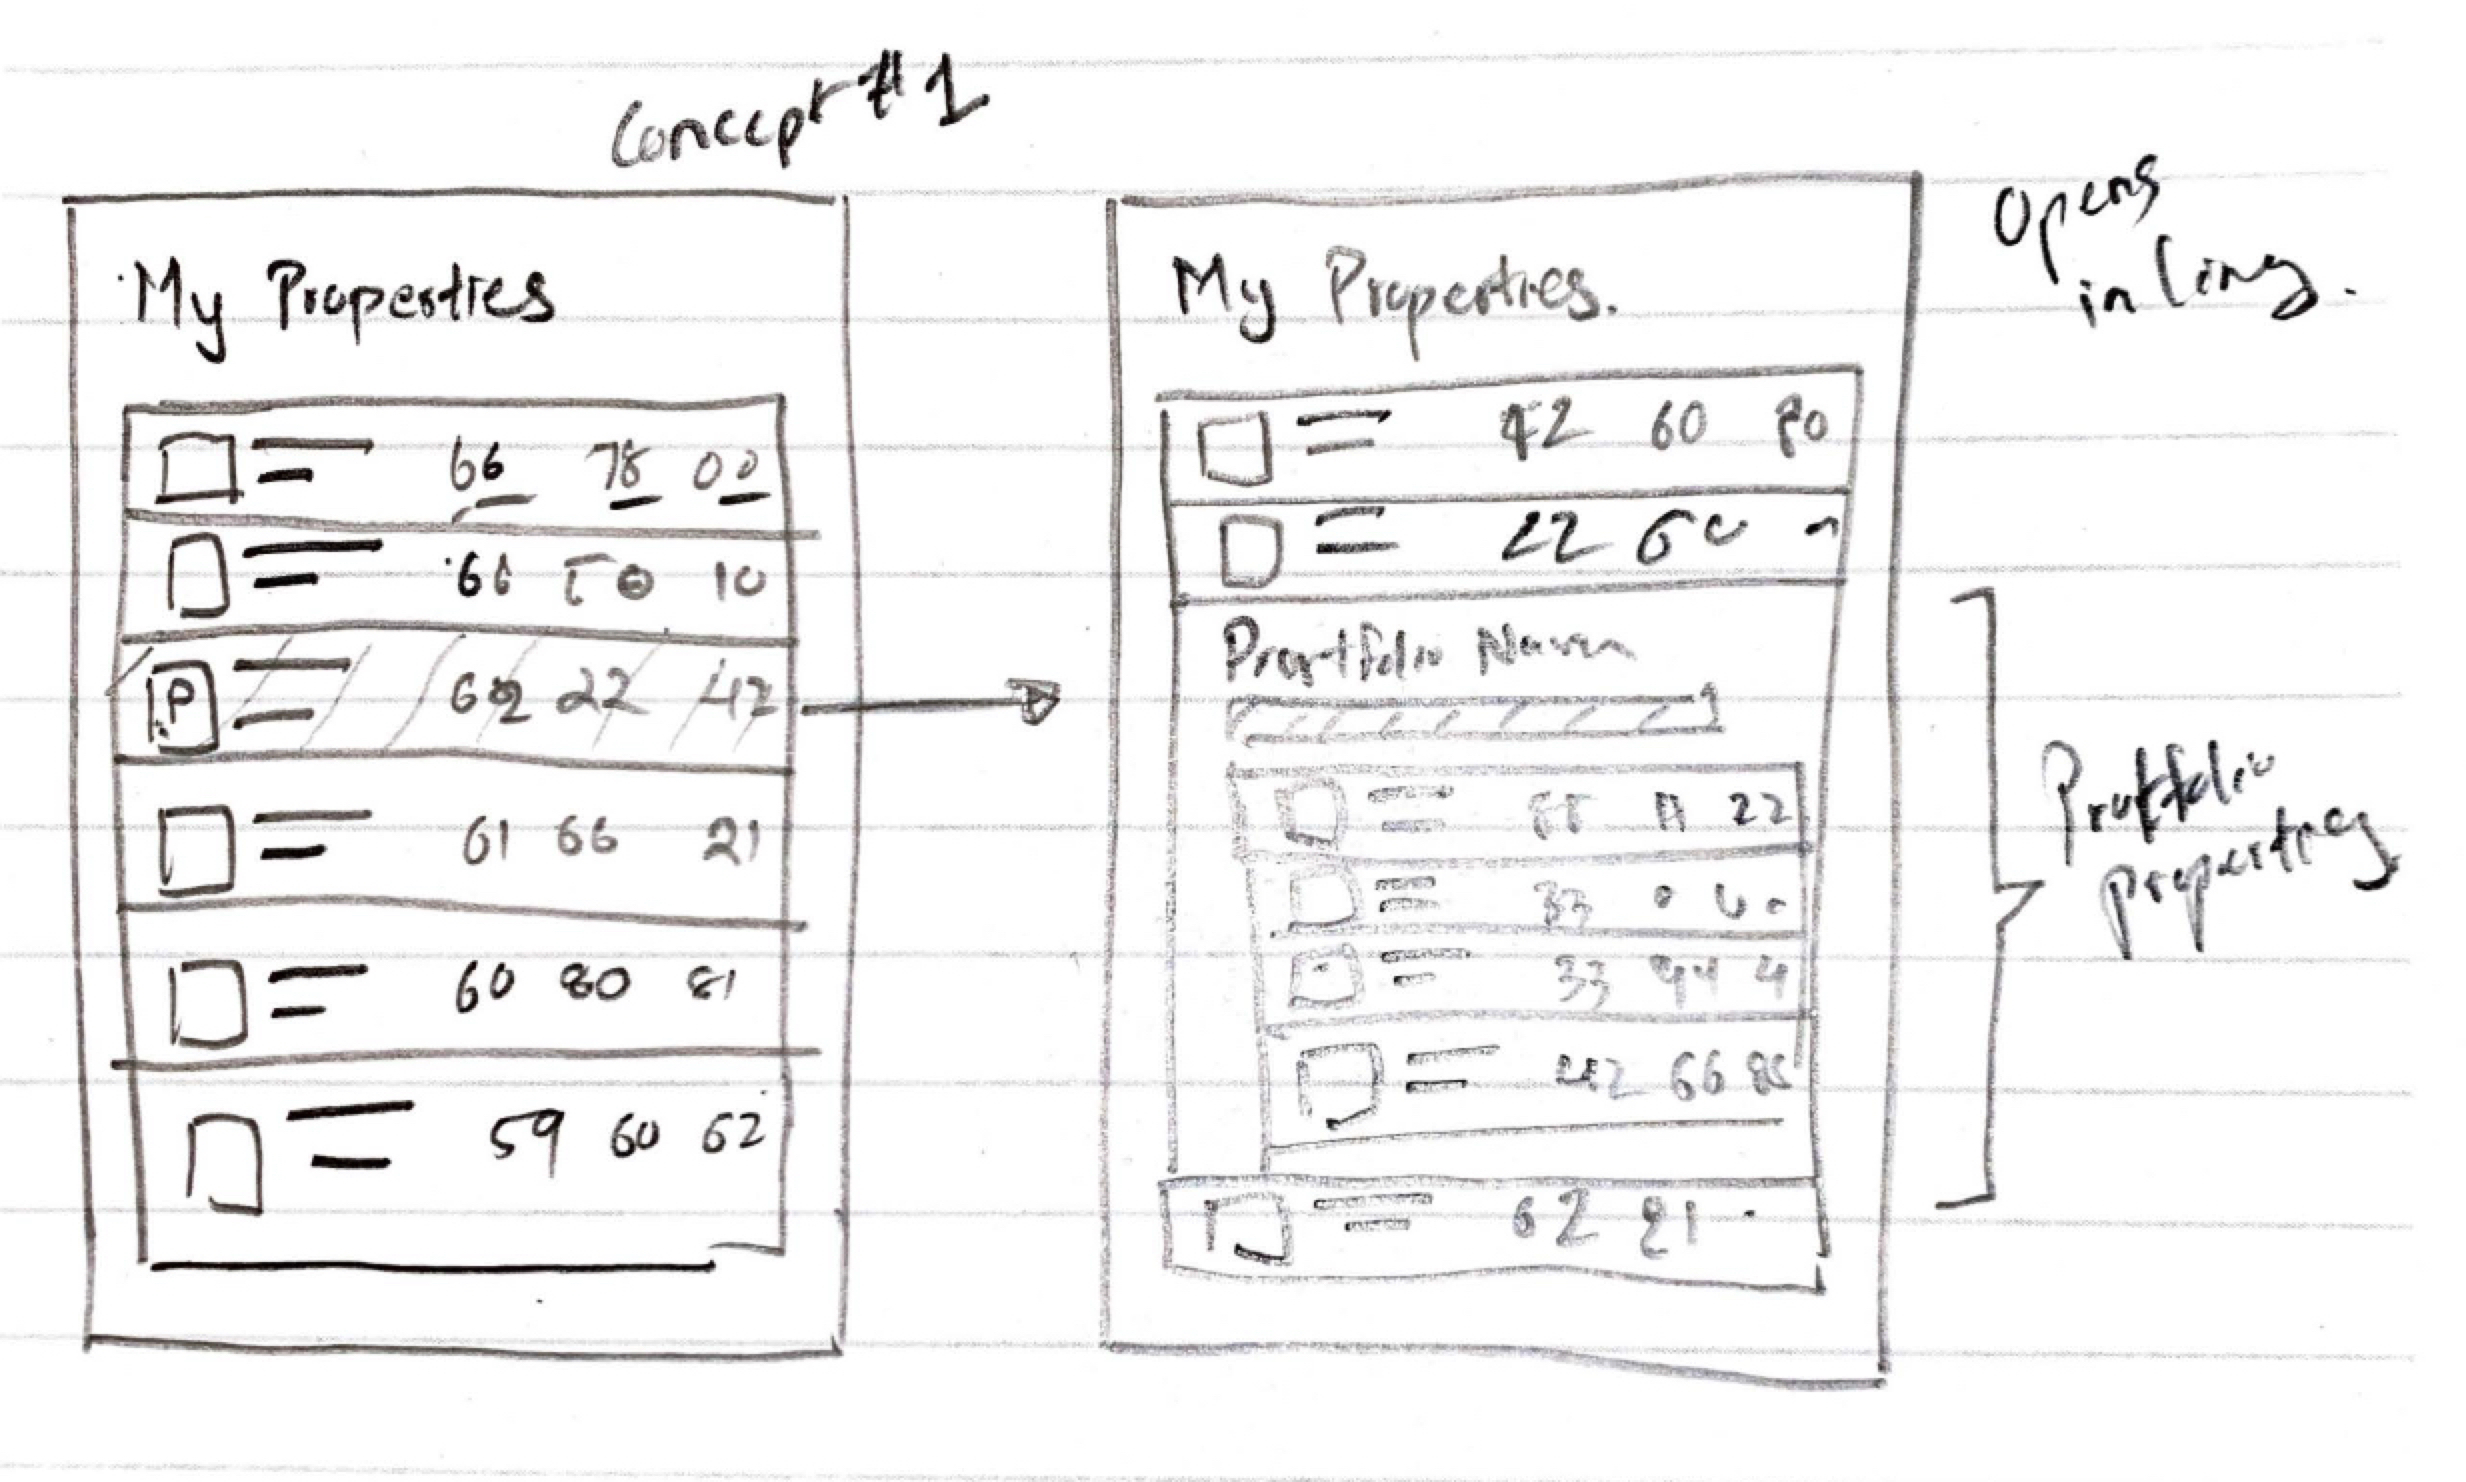
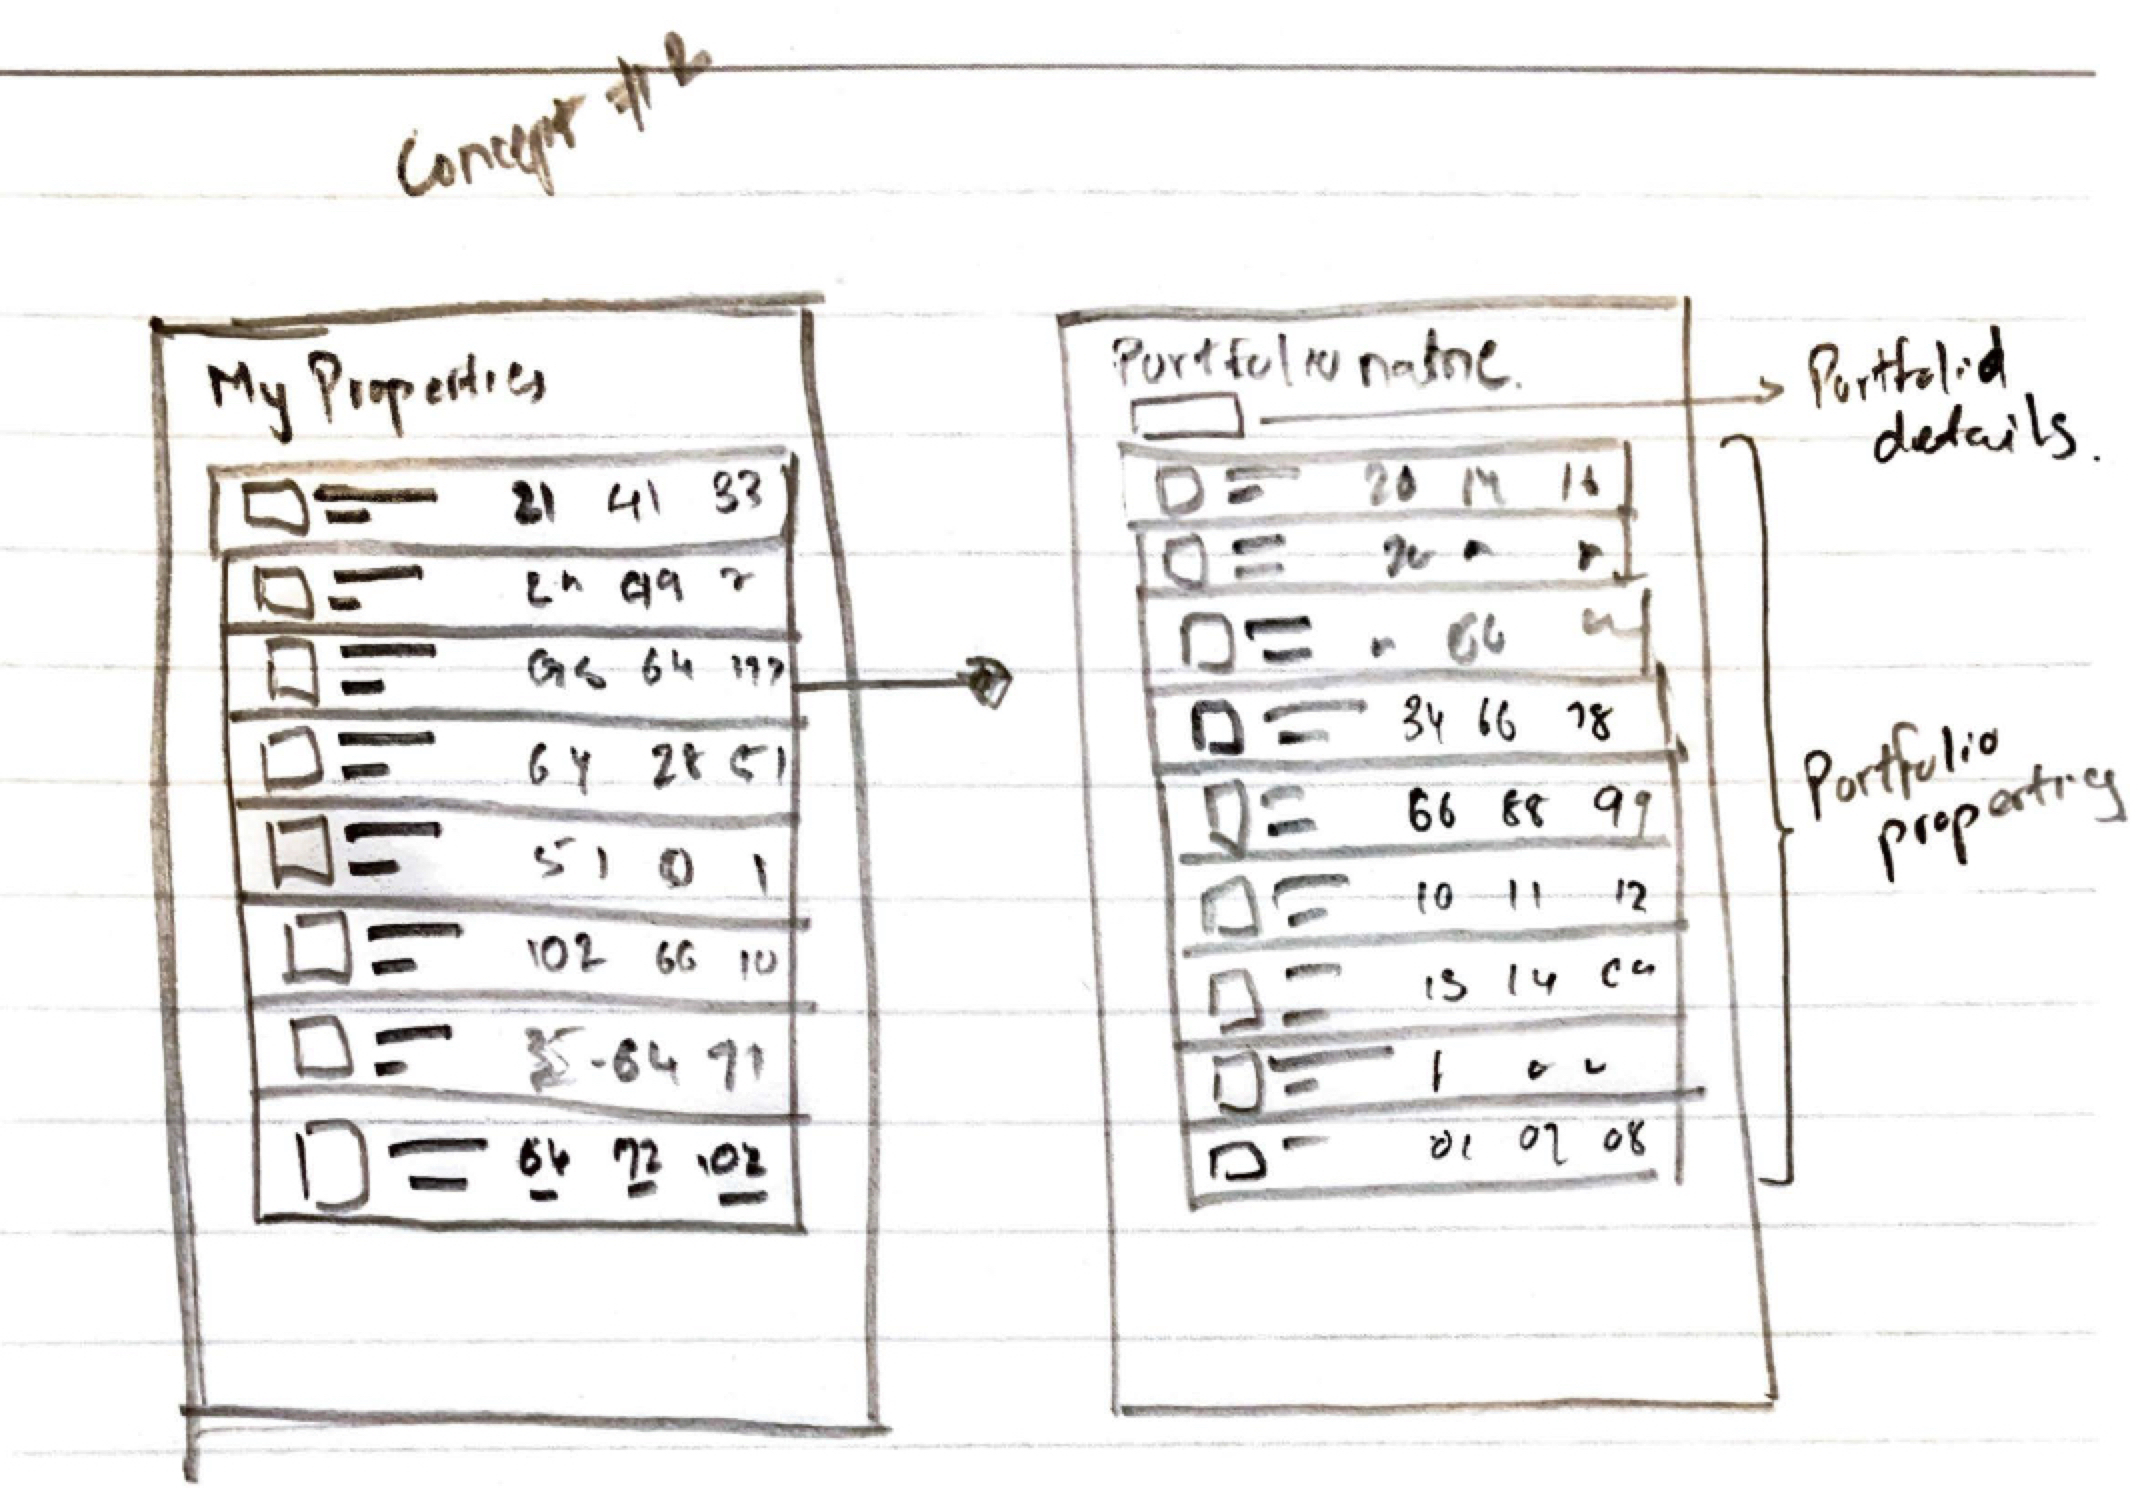
Sketching ideas helped me understand various ways users could access the dashboard. It was absolutely important to make use of the set navigation patterns on the website and build on top of it so the flow feels natural and the dashboard is easily accessible.
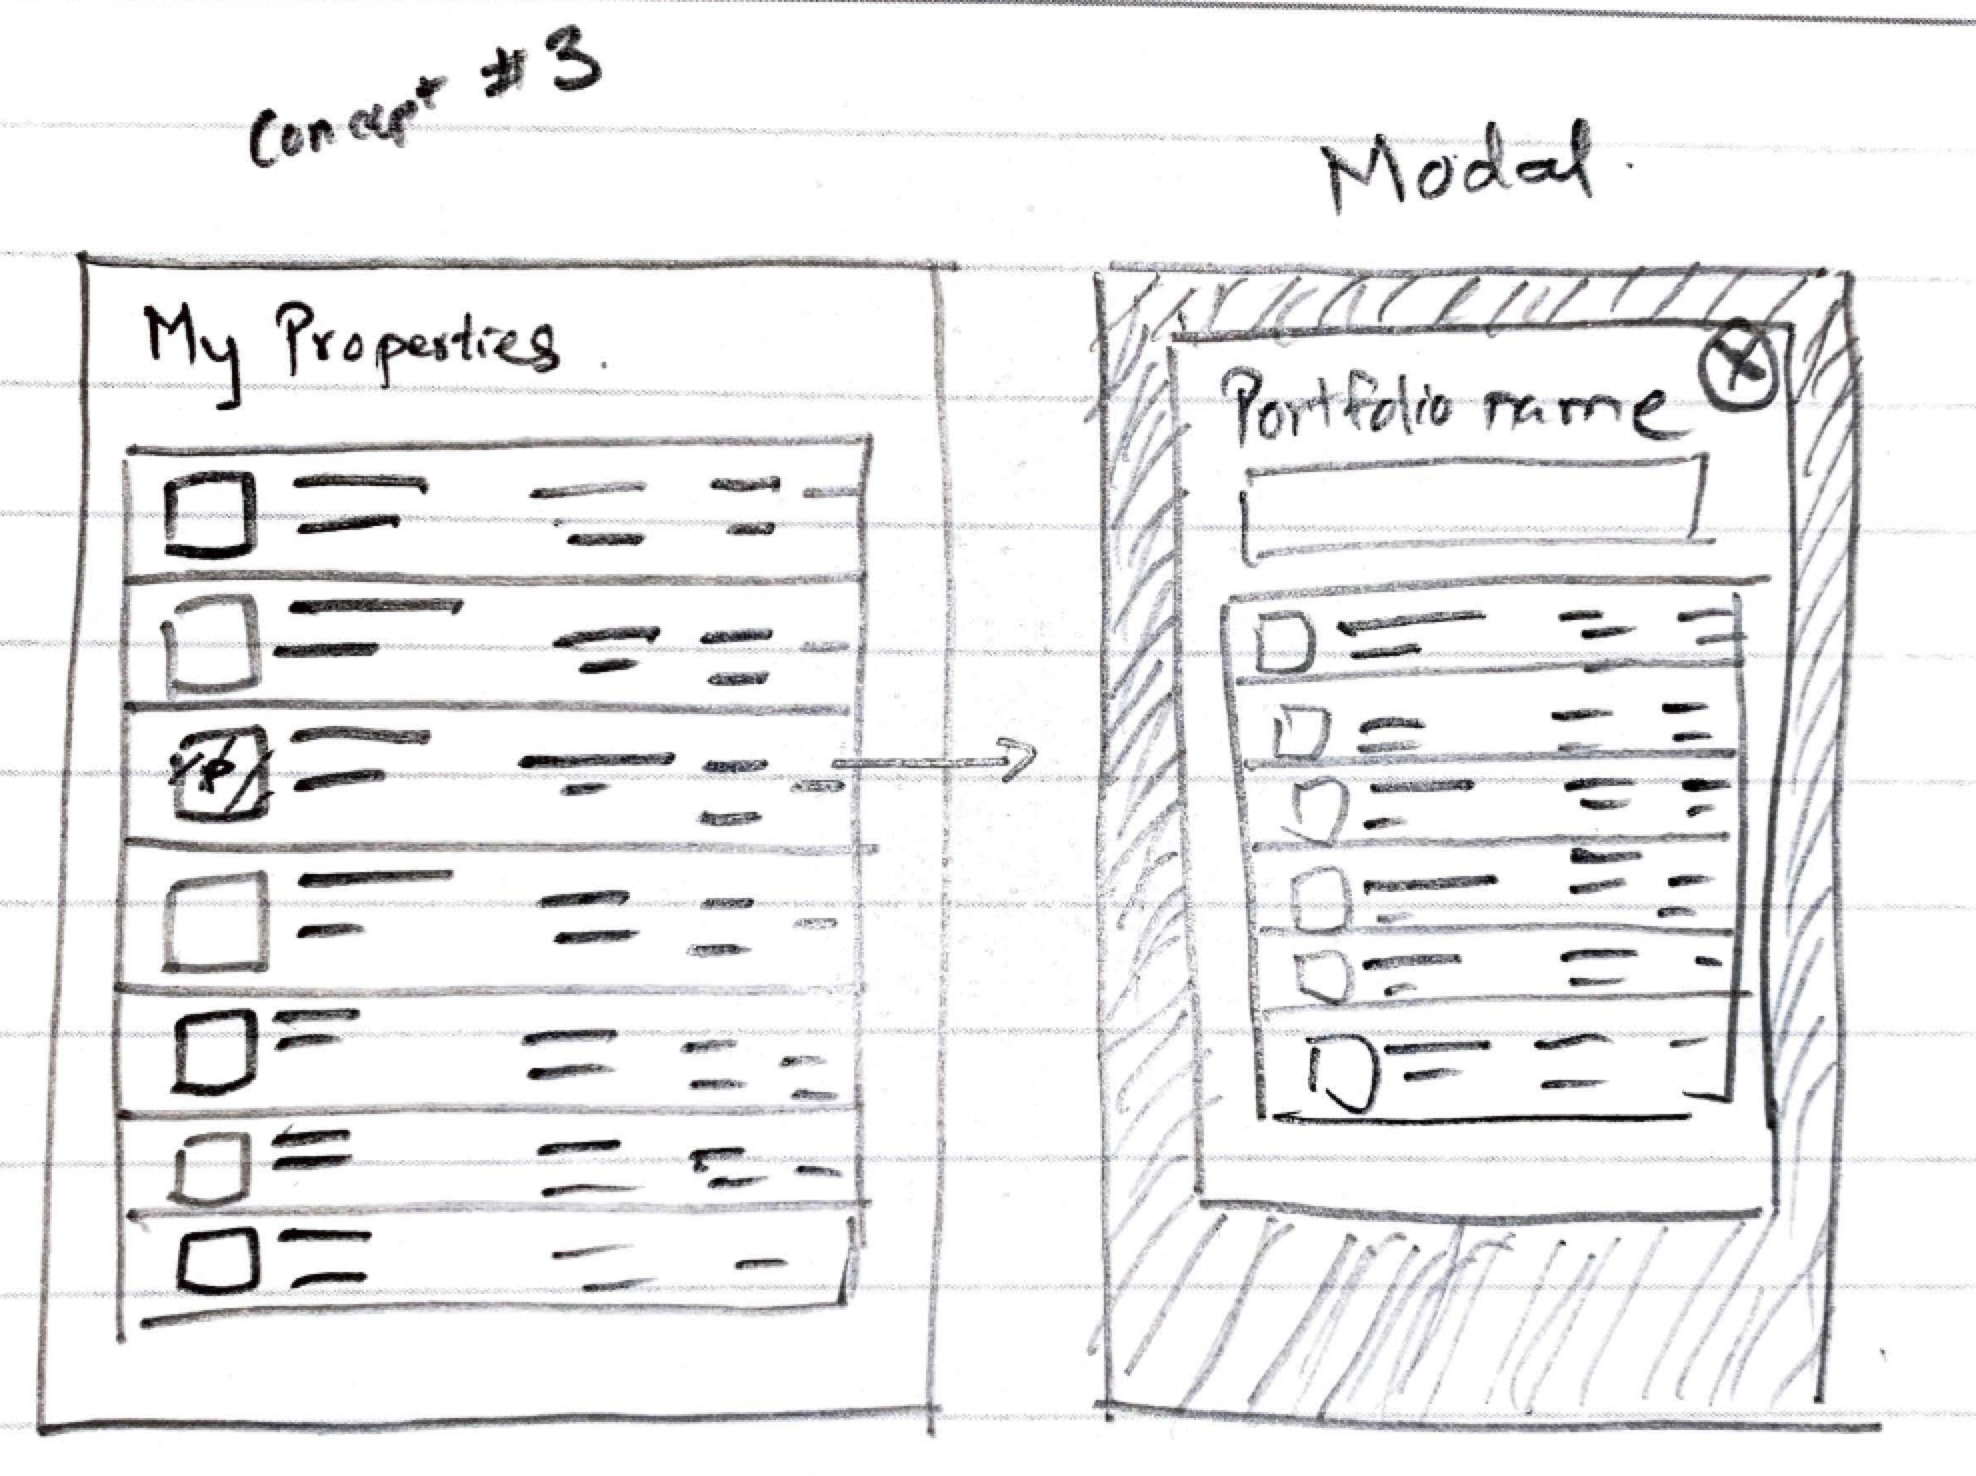
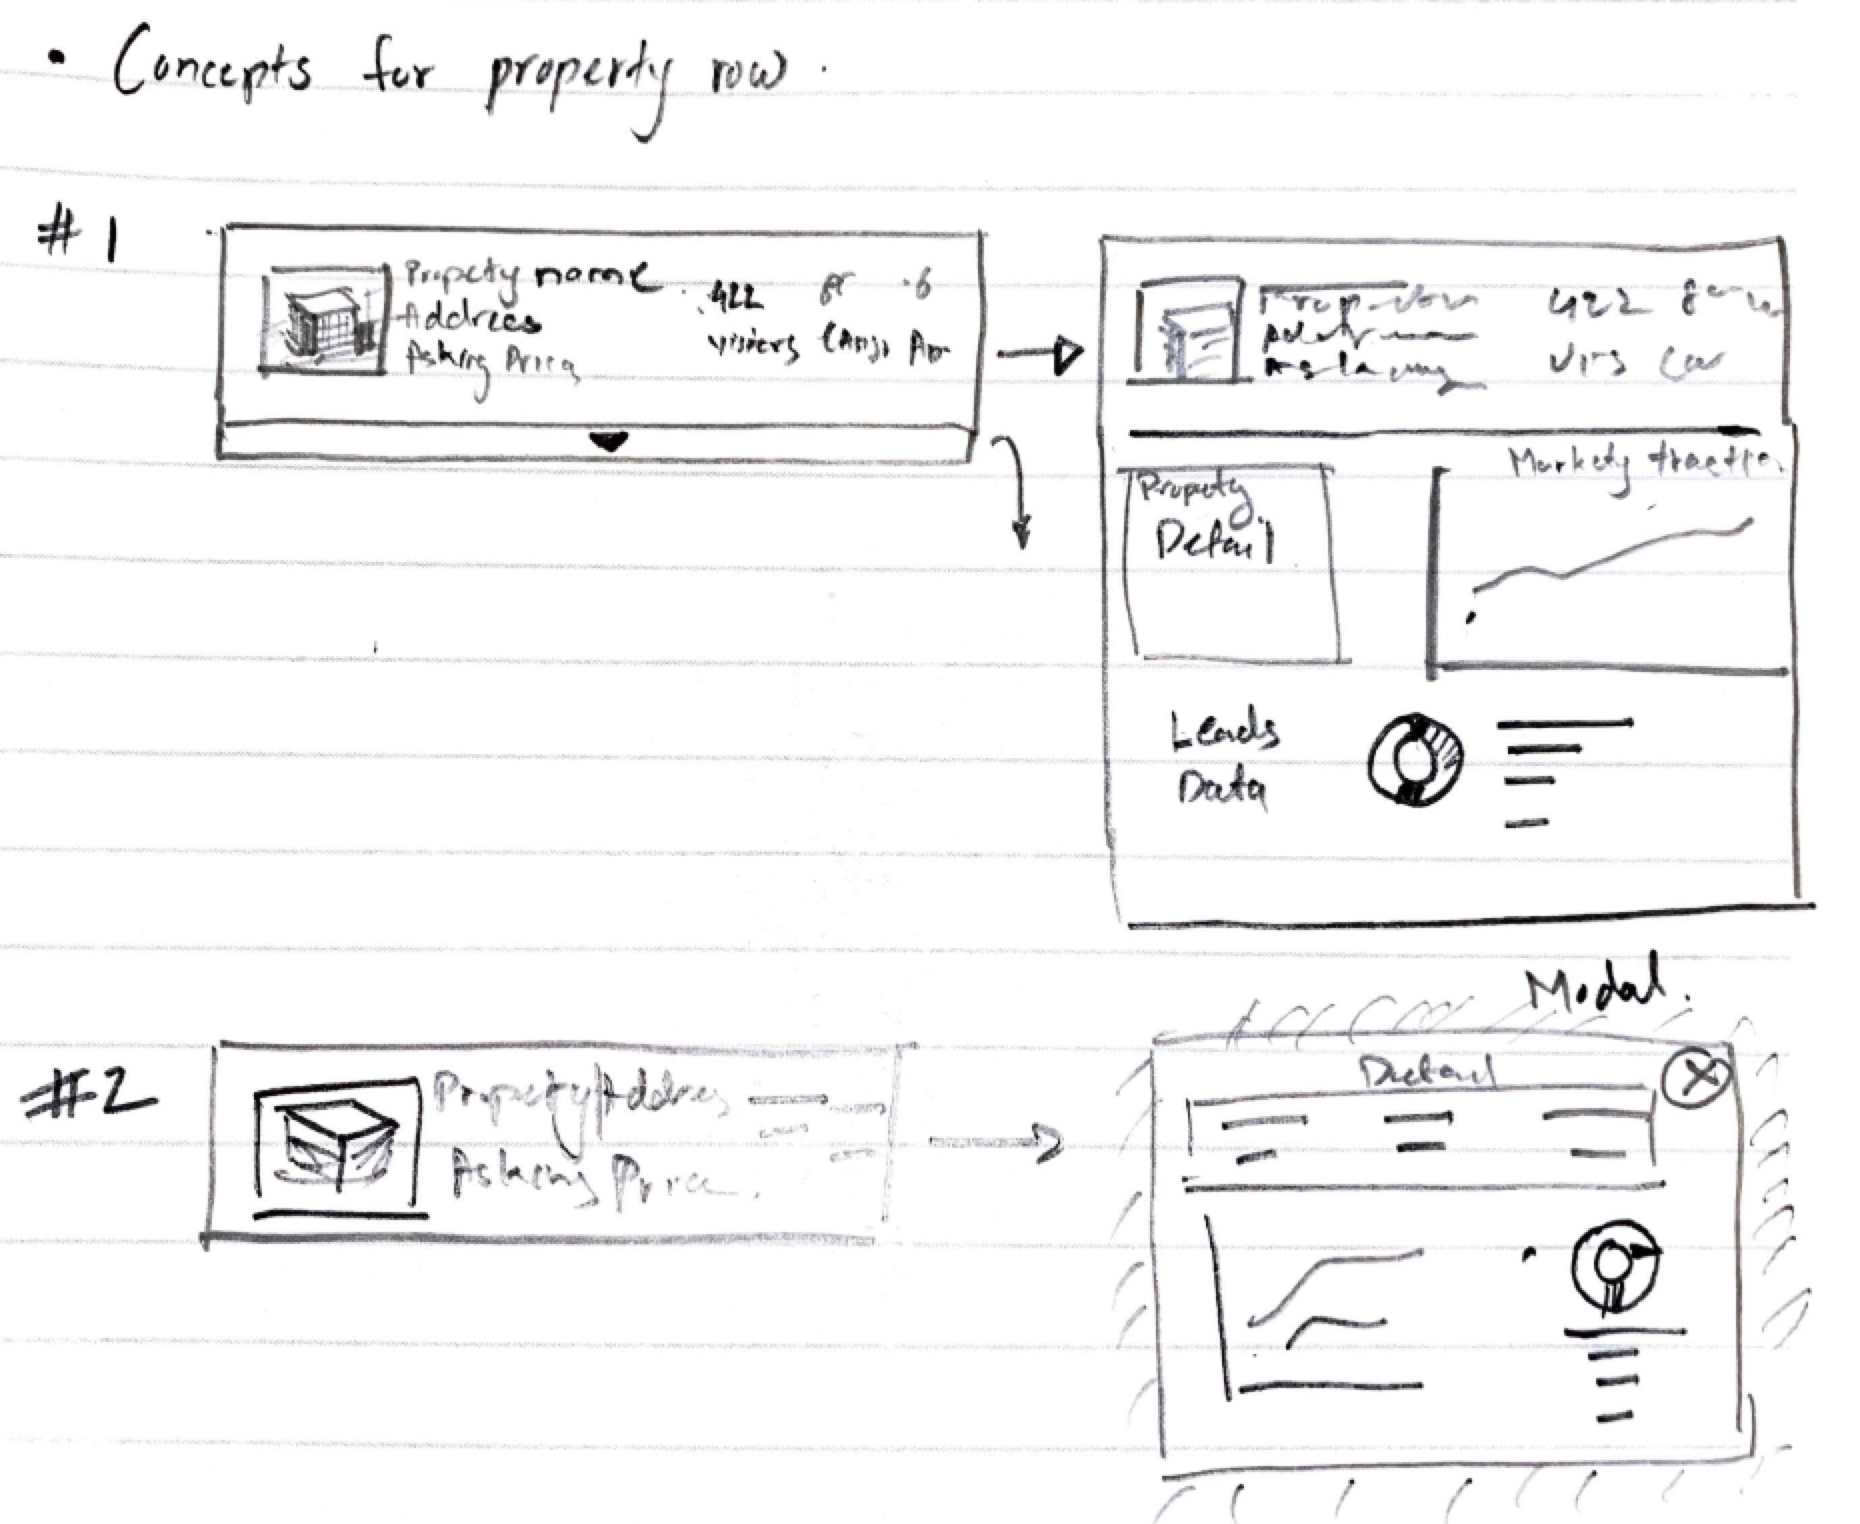
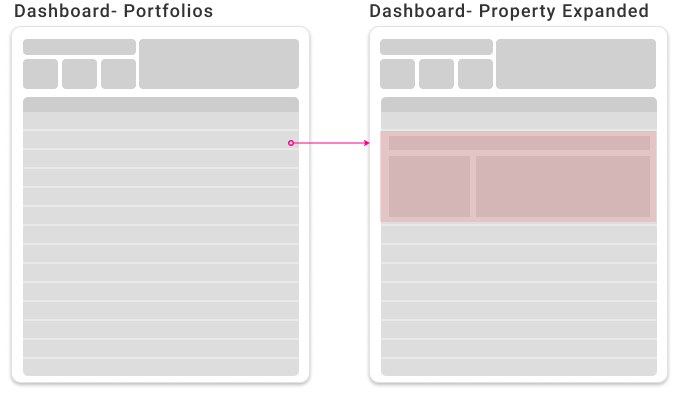
I sketched user interaction concepts to explore ideas on how users could expand and minimize property details allowing them easy and and intuitive way to access property information.
User Flow
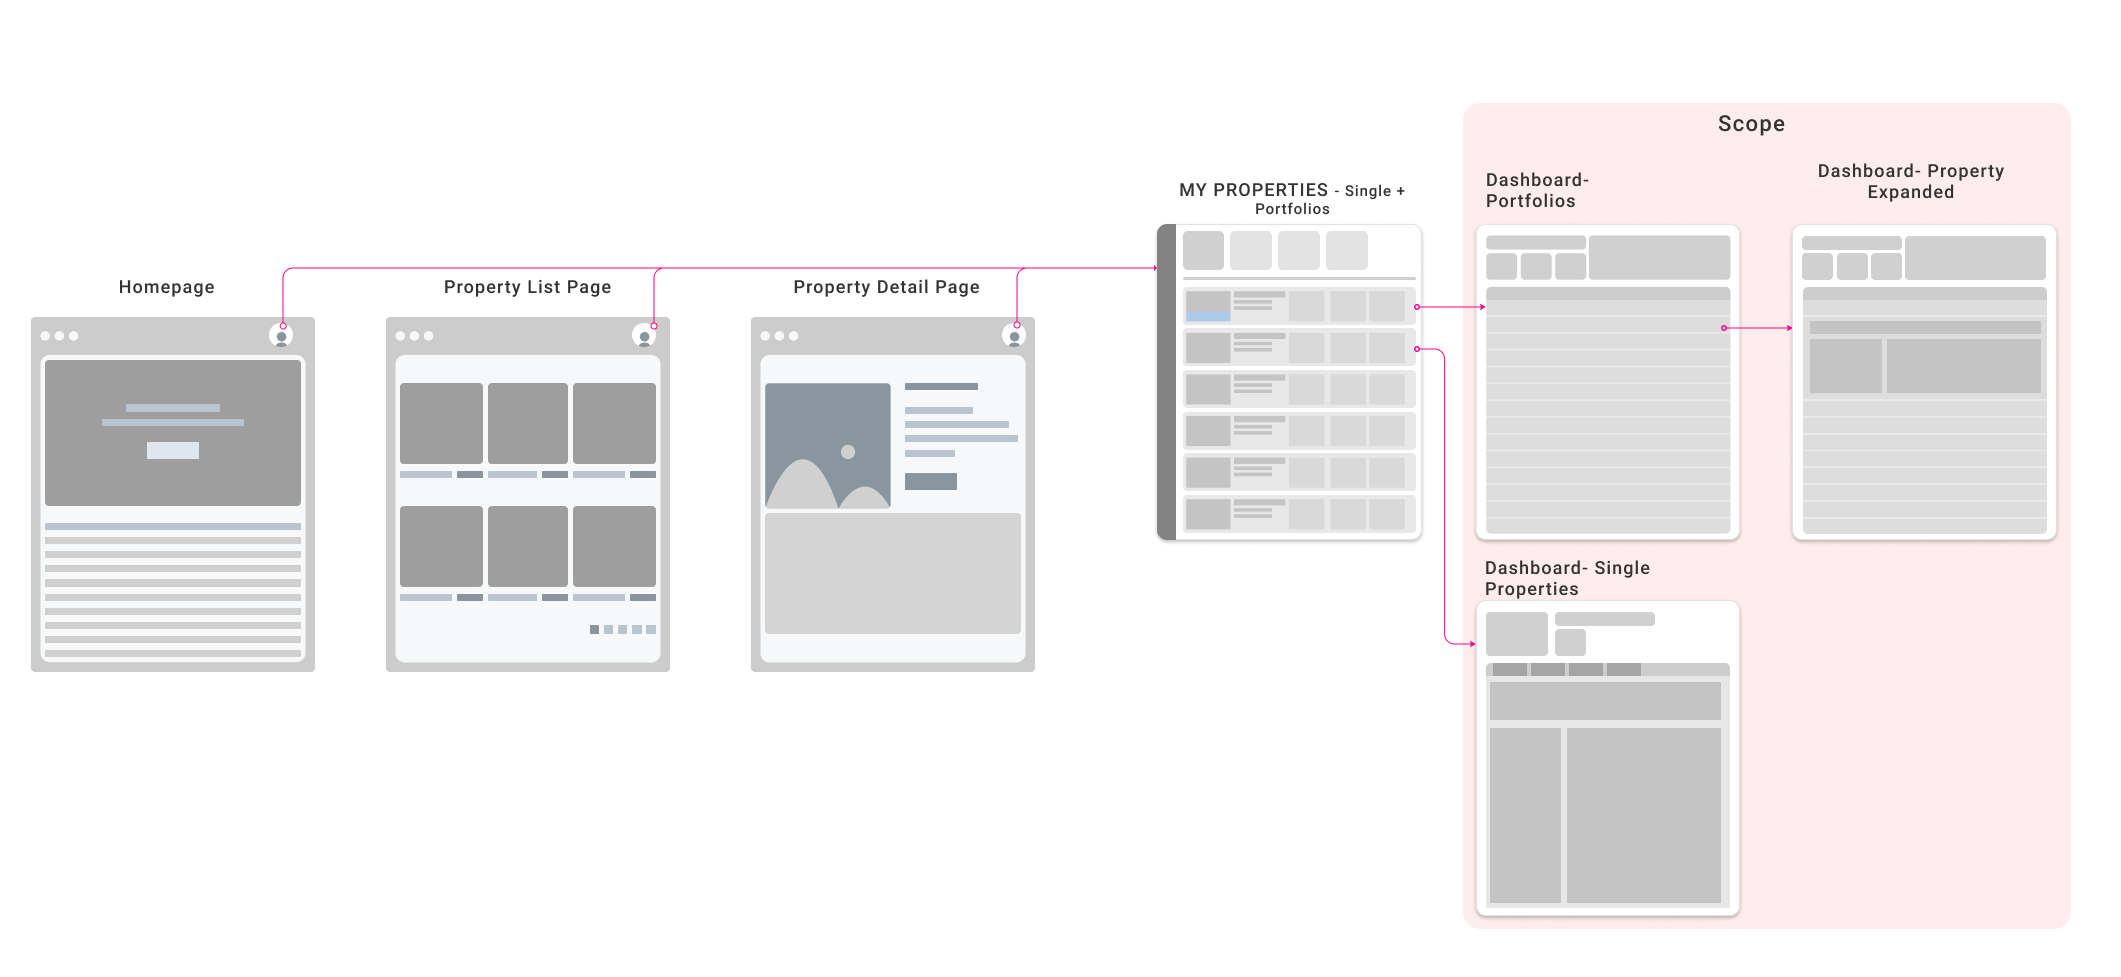
I put together the high-level flows to determine how the user would access the dashboard. In addition, the solution also had to be consistent with a single property dashboard flow. This exercise allowed us to think about several strategies that display information and enable customers to filter information. Flow helped the developers to set up the backend and frontend data flow.
Prototyping
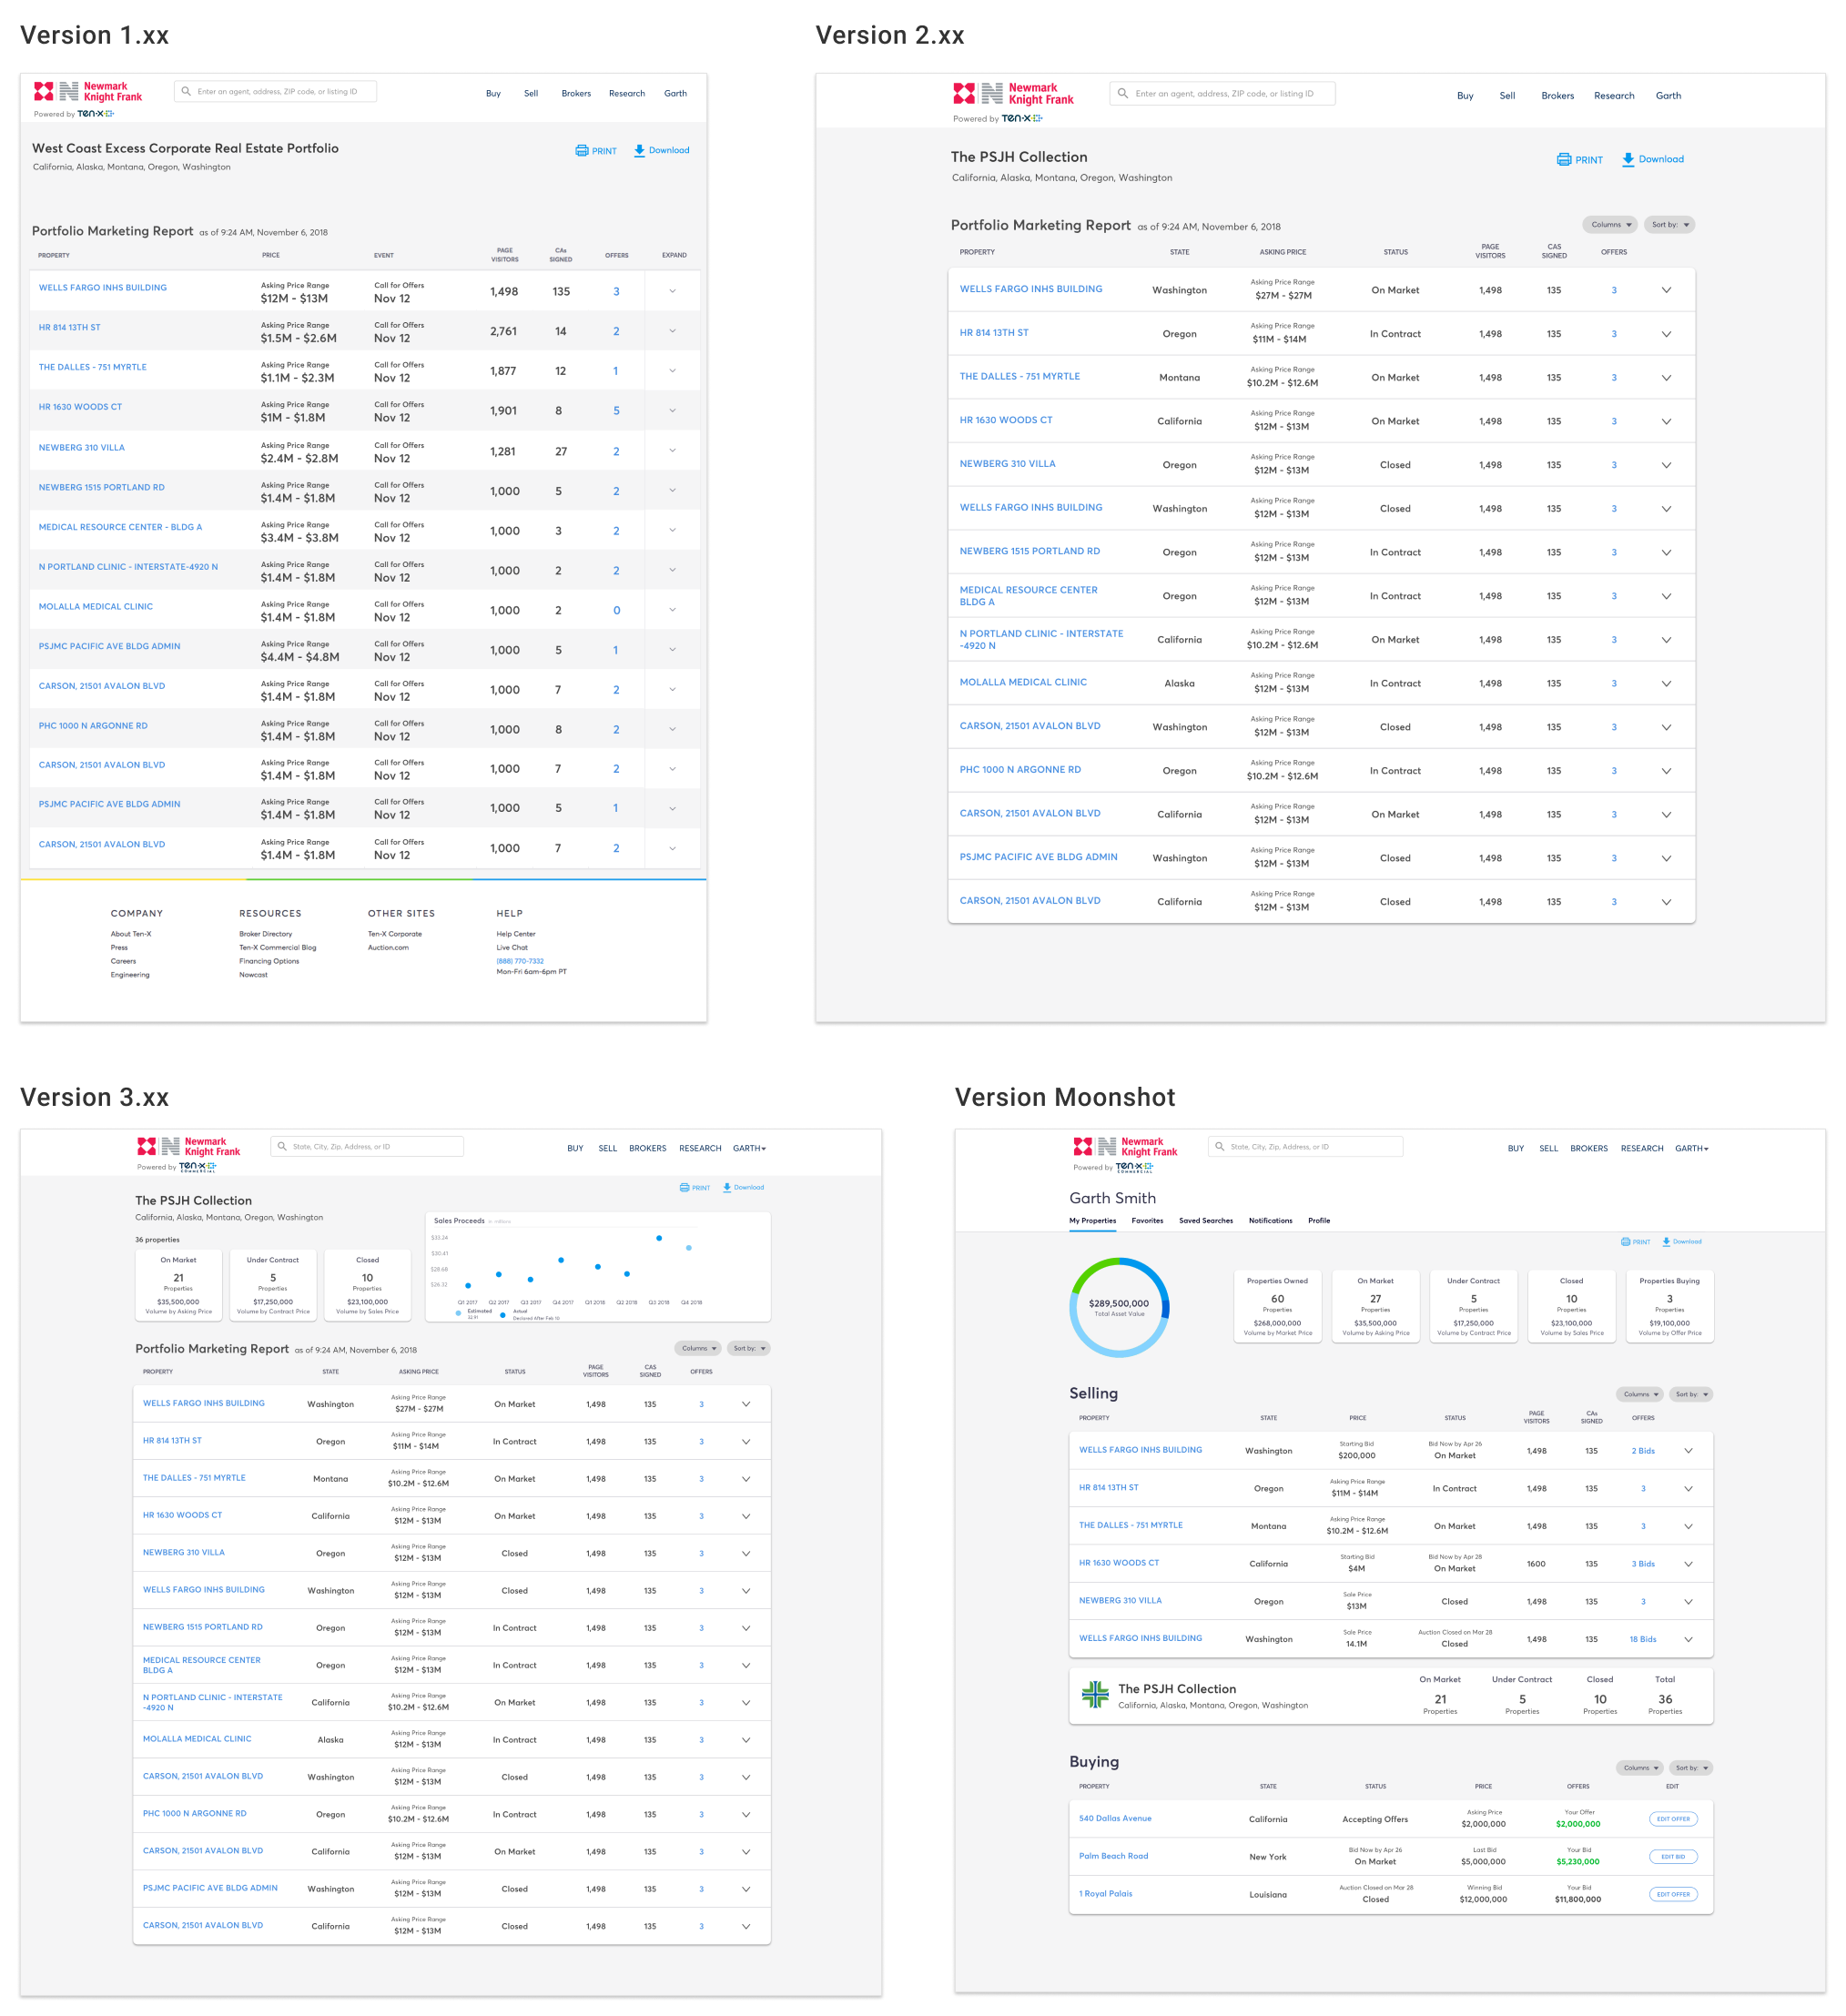
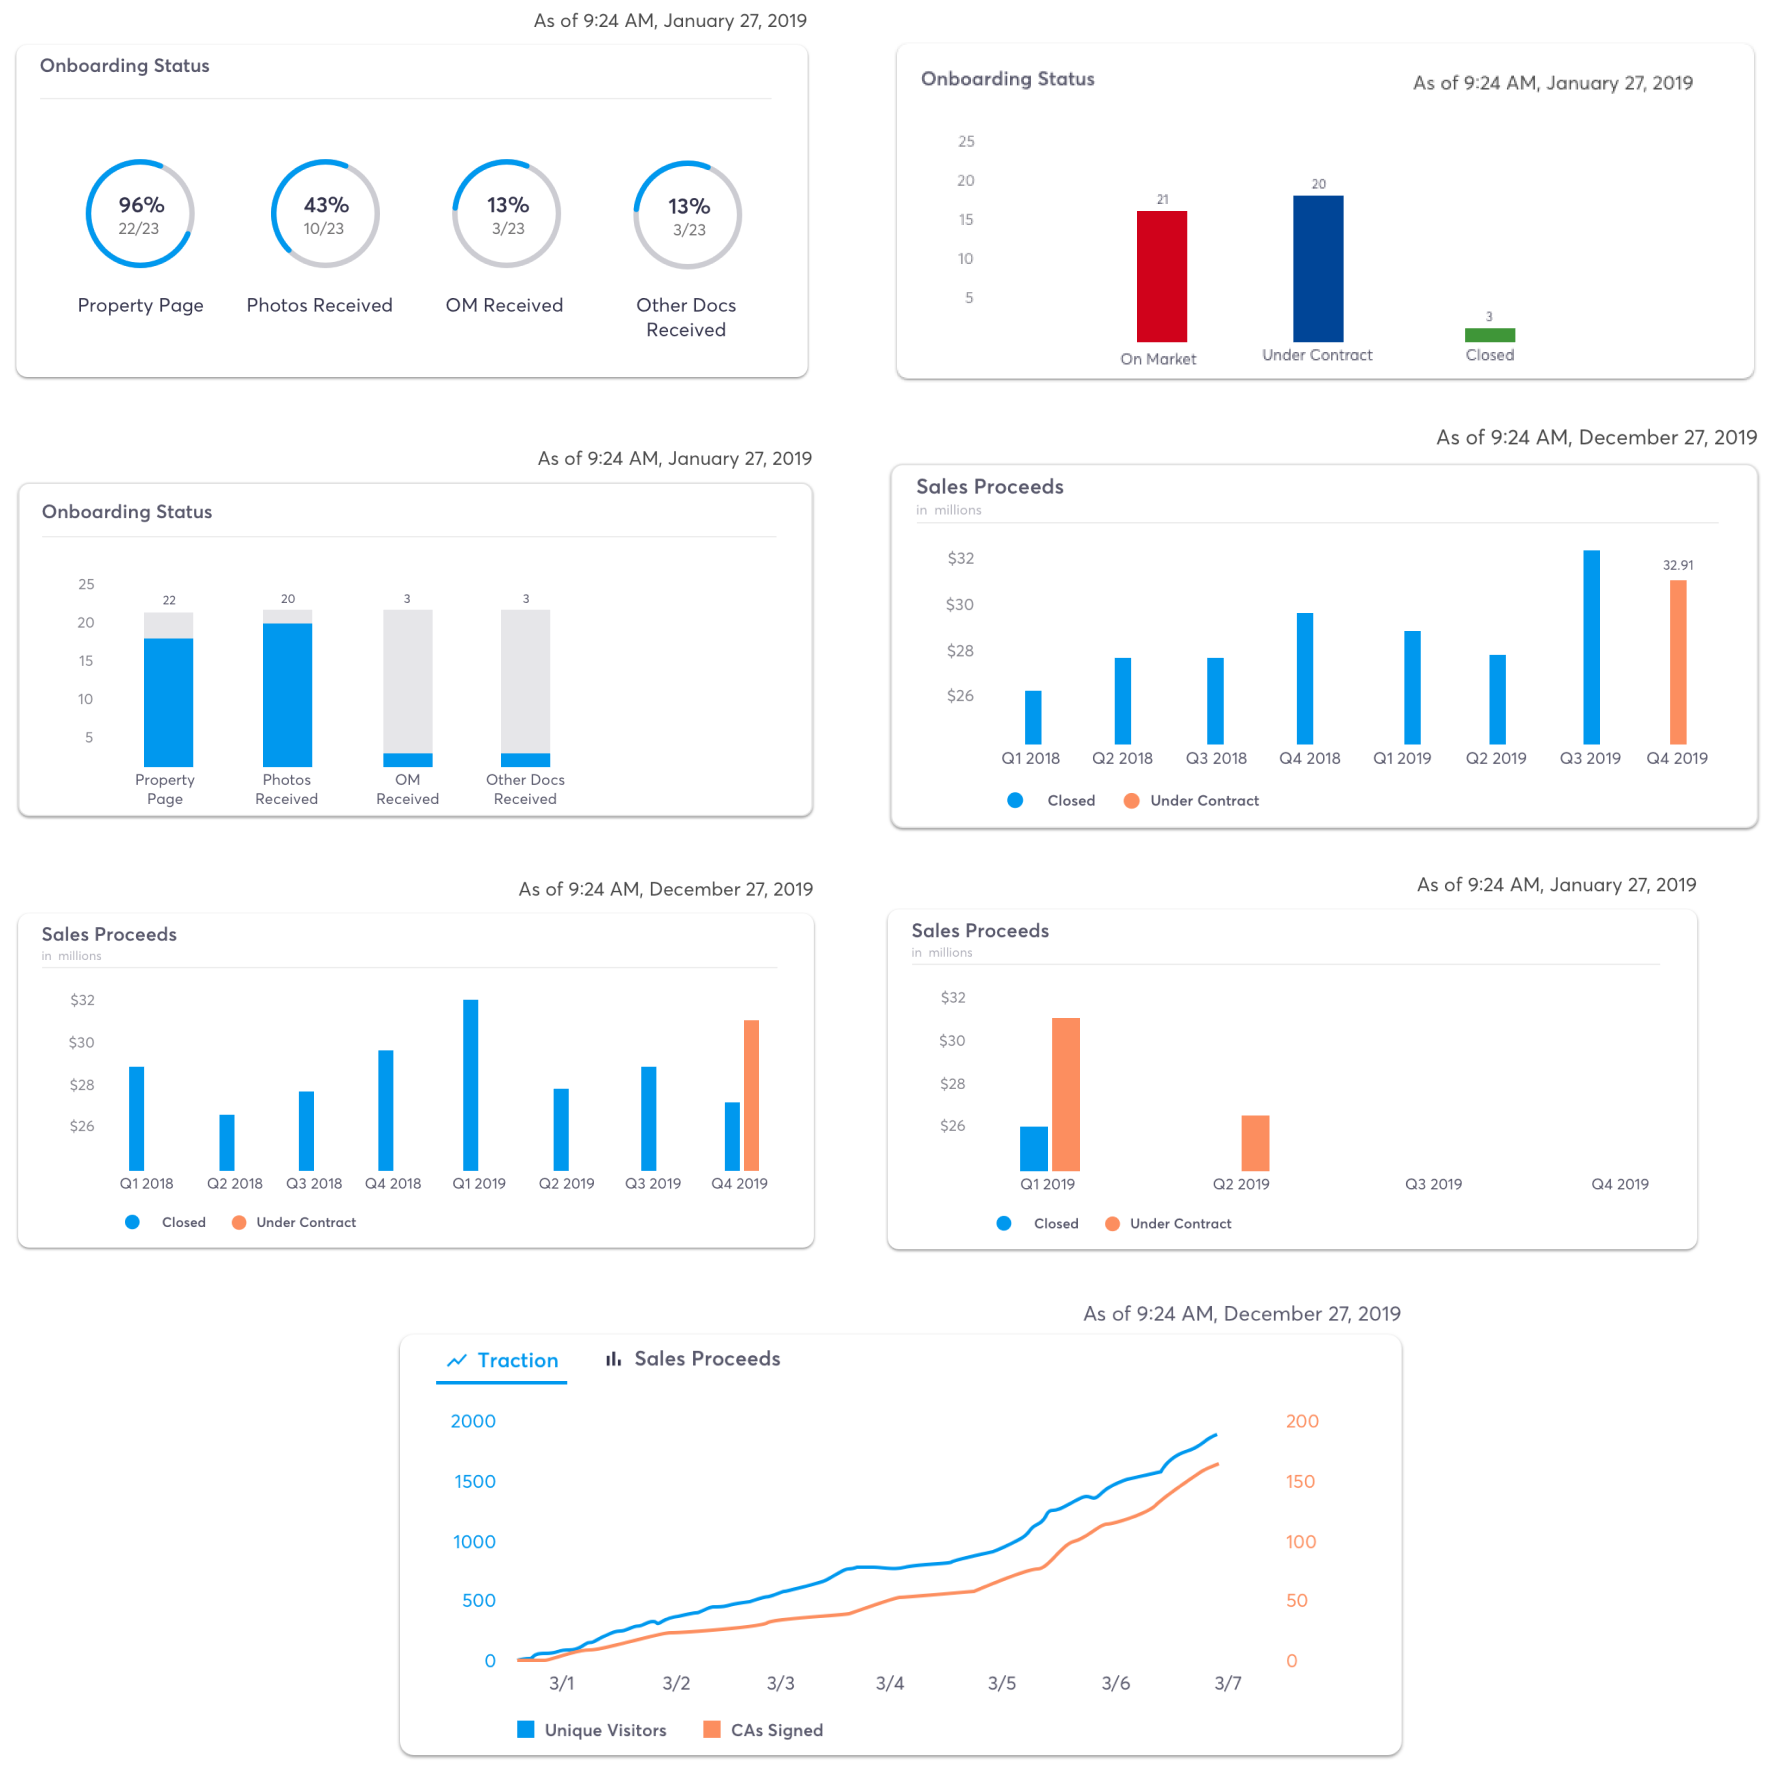
Once I started putting the basic pieces of dashboard such as filters, data-sets, and interactions. Our stakeholders got tremendously excited and wanted us to explore how we could make the data visual and enable the sellers to see the progress of the sale without much digging. In the process we introduced sale proceeds which would help estimate the sales revenue for the sellers.
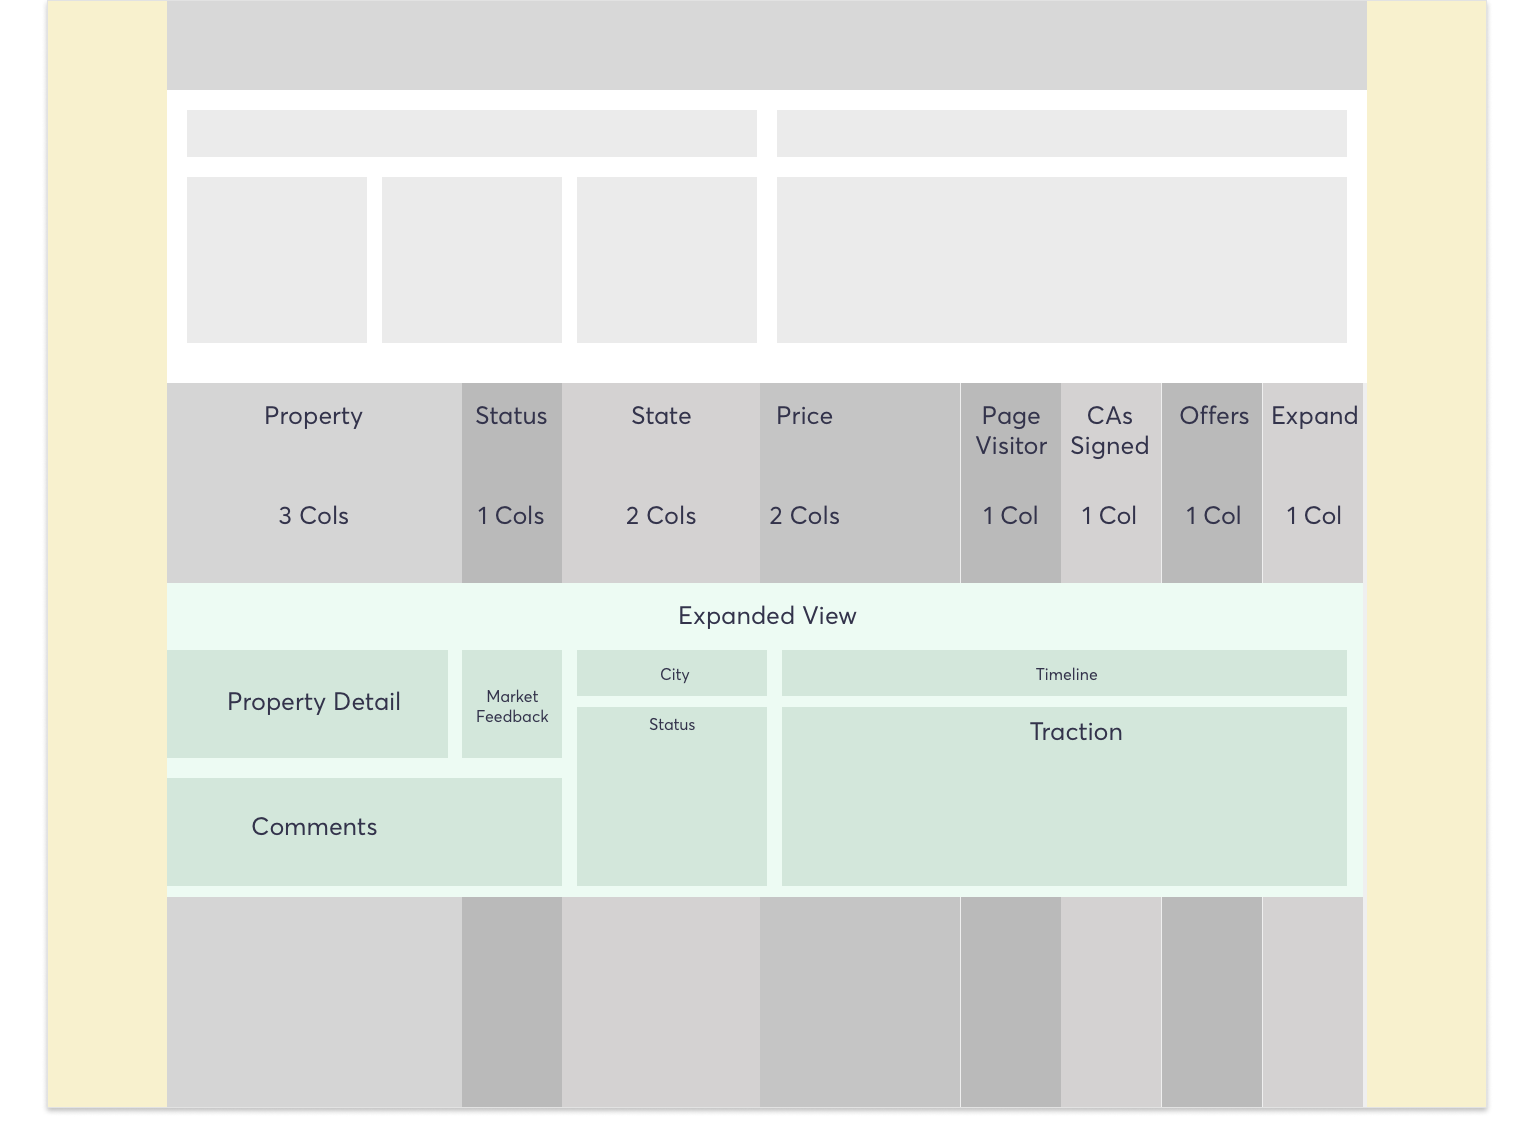
As we were moving closer to finalizing the layouts and data on the dashboard, the grid and layout requirements needed to be solidified. I defined the grid structure for the developers adhering to responsive design approach.
The grid needed to accommodate the expanded level of property row allowing graphs and data lists to be filled in spaces adequately. We had multiple rounds of interaction, testing font sizes, spacing, padding to test extreme scenarios.
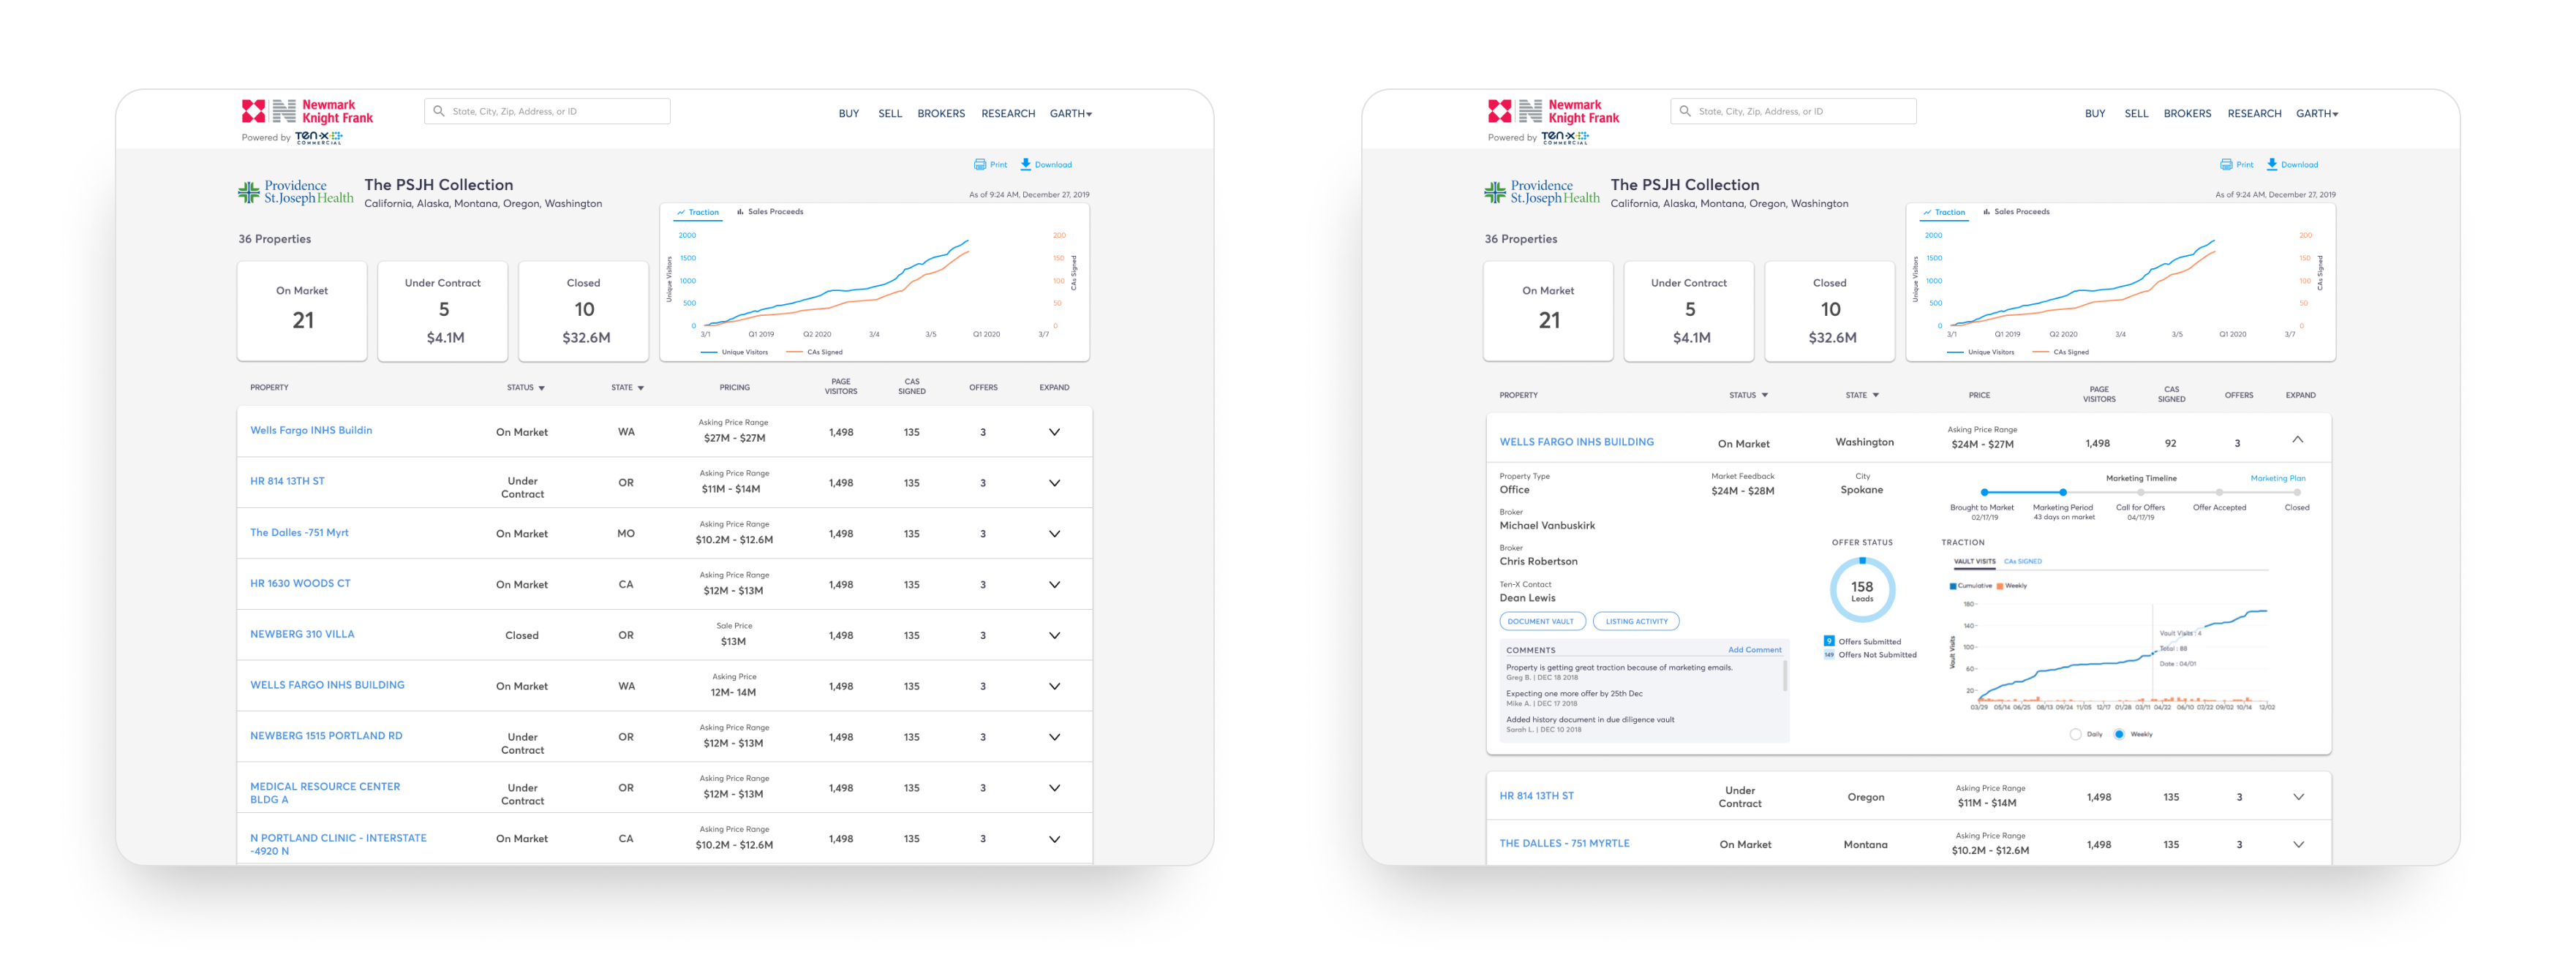
Getting the right set of filters and data visualization was crucial in the header. This was the first view for sellers and provided a quick snapshot of the portfolio status. I experimented with several data visualizations that could go into the header before it was concluded that Sales Proceeds and Traction were two important metrics that would be perfect for the broker/seller executives to track progress.
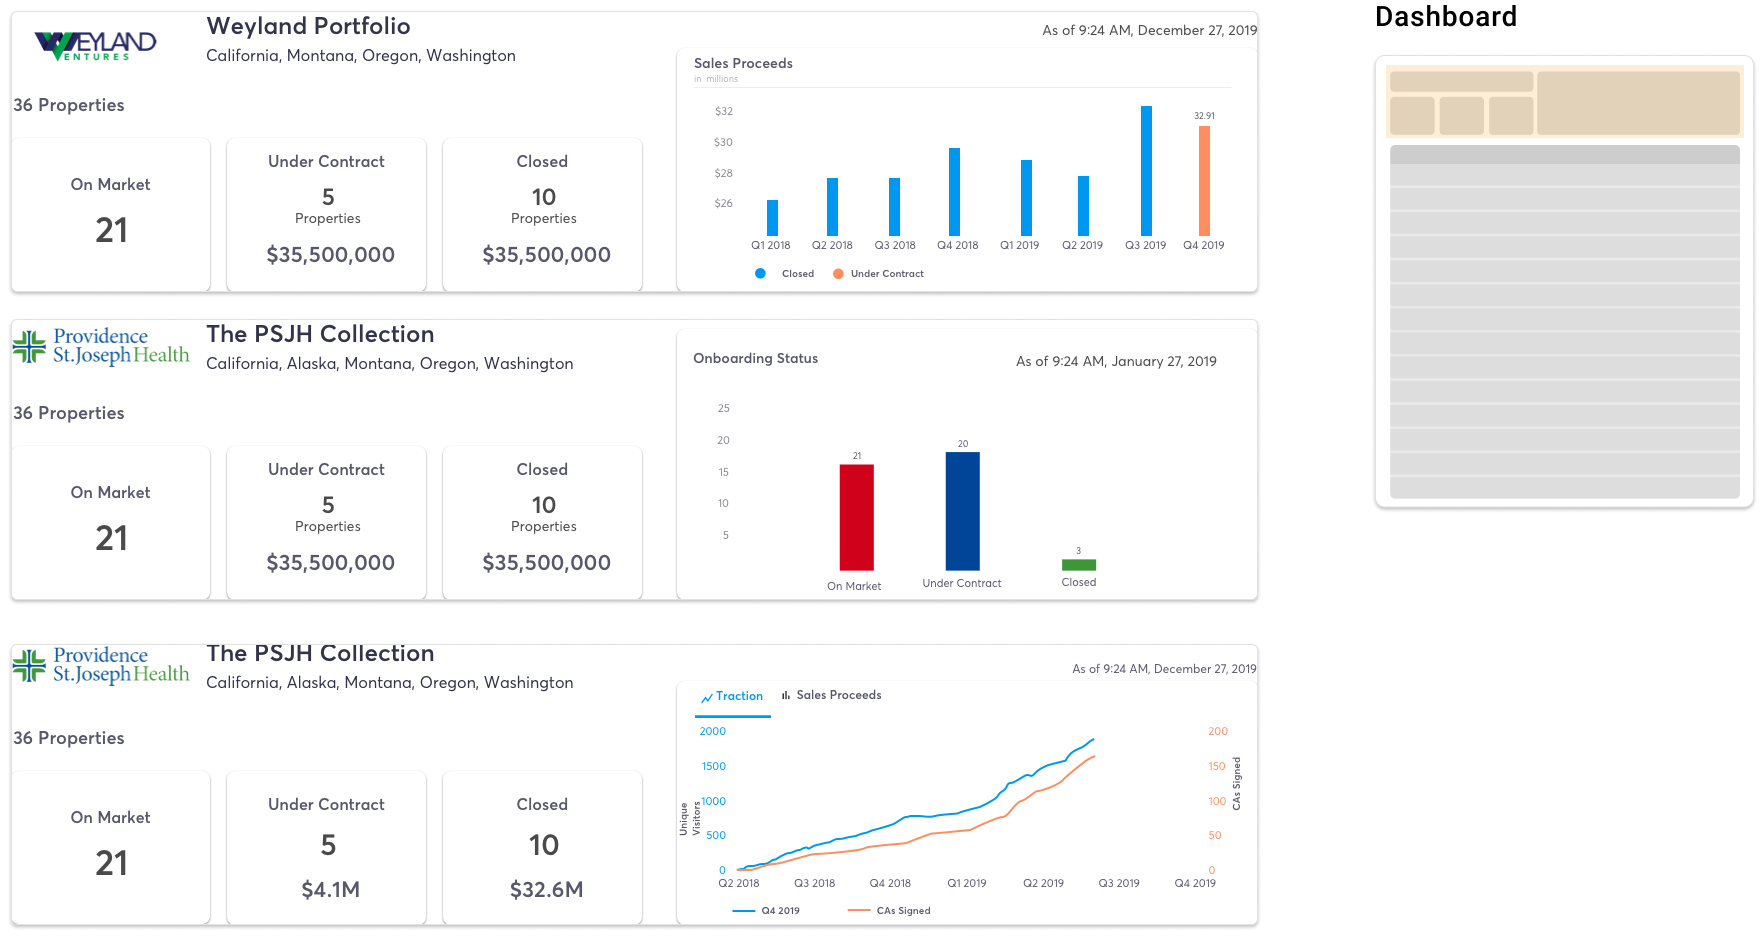
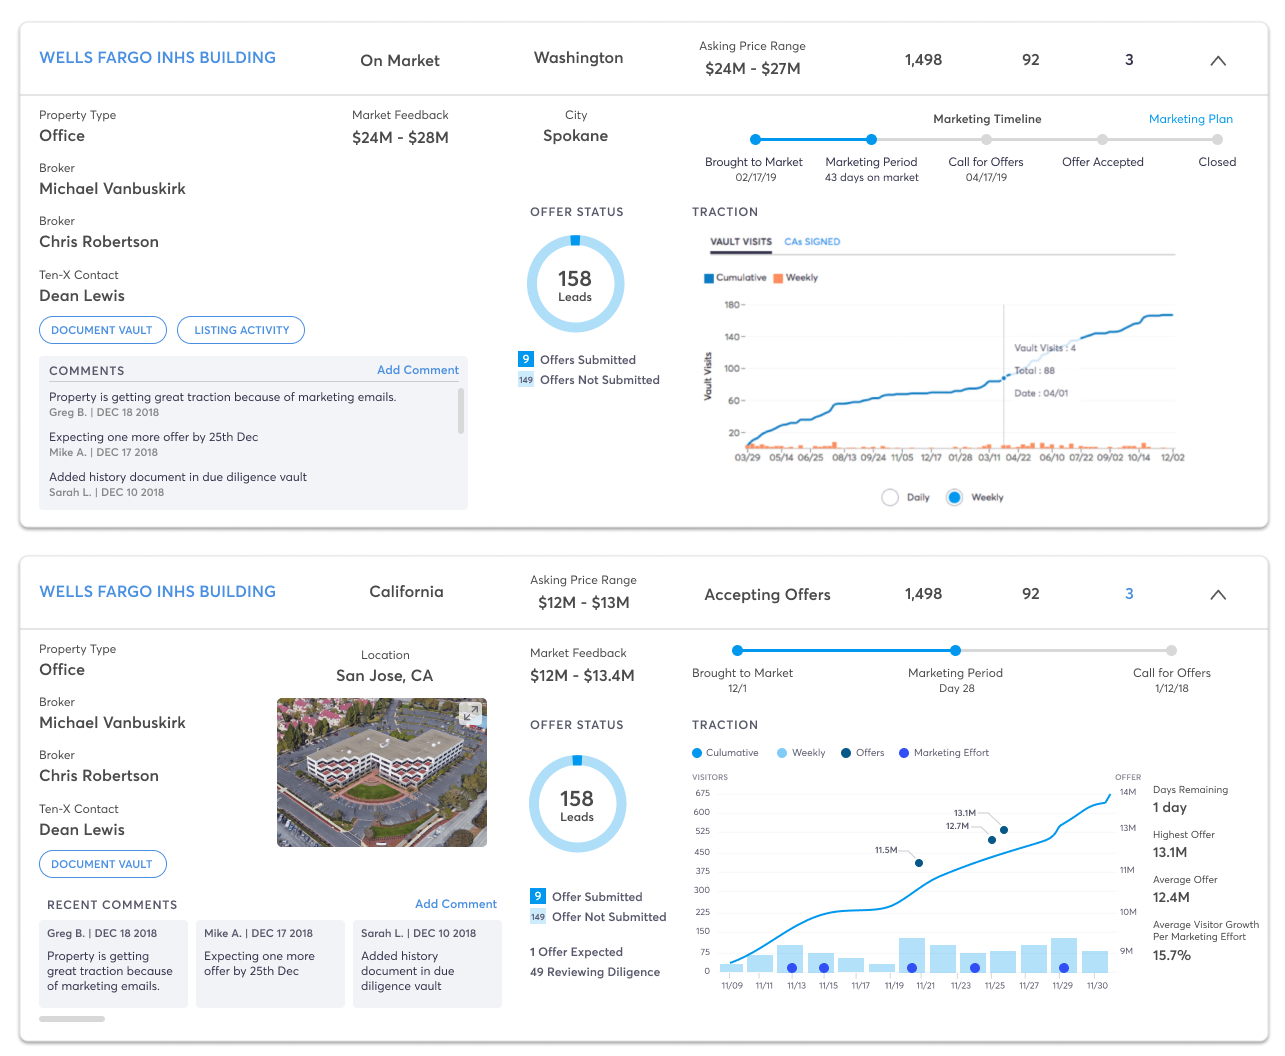
Expanded views of each property were meticulously put together to show only the most relevant items that customers could act upon. Leads, listing traction, timeline, buyer notes were the most important pieces that demanded attention and hence were prioritized. If required customers could access additional data through links that were put in the expanded view.
Finalized Version
Key Features

Data-Rich
By sourcing, distilling, and surfacing the most important data from numerous databases, the dashboard becomes incredibly data-rich.

Real Time
APIs are called periodically to keep the data updated giving the customers real-time updates thus the dashboard becomes a source of truth.

Scalable
Design is built for scale as it can accommodate portfolios as well as a group of discrete properties.

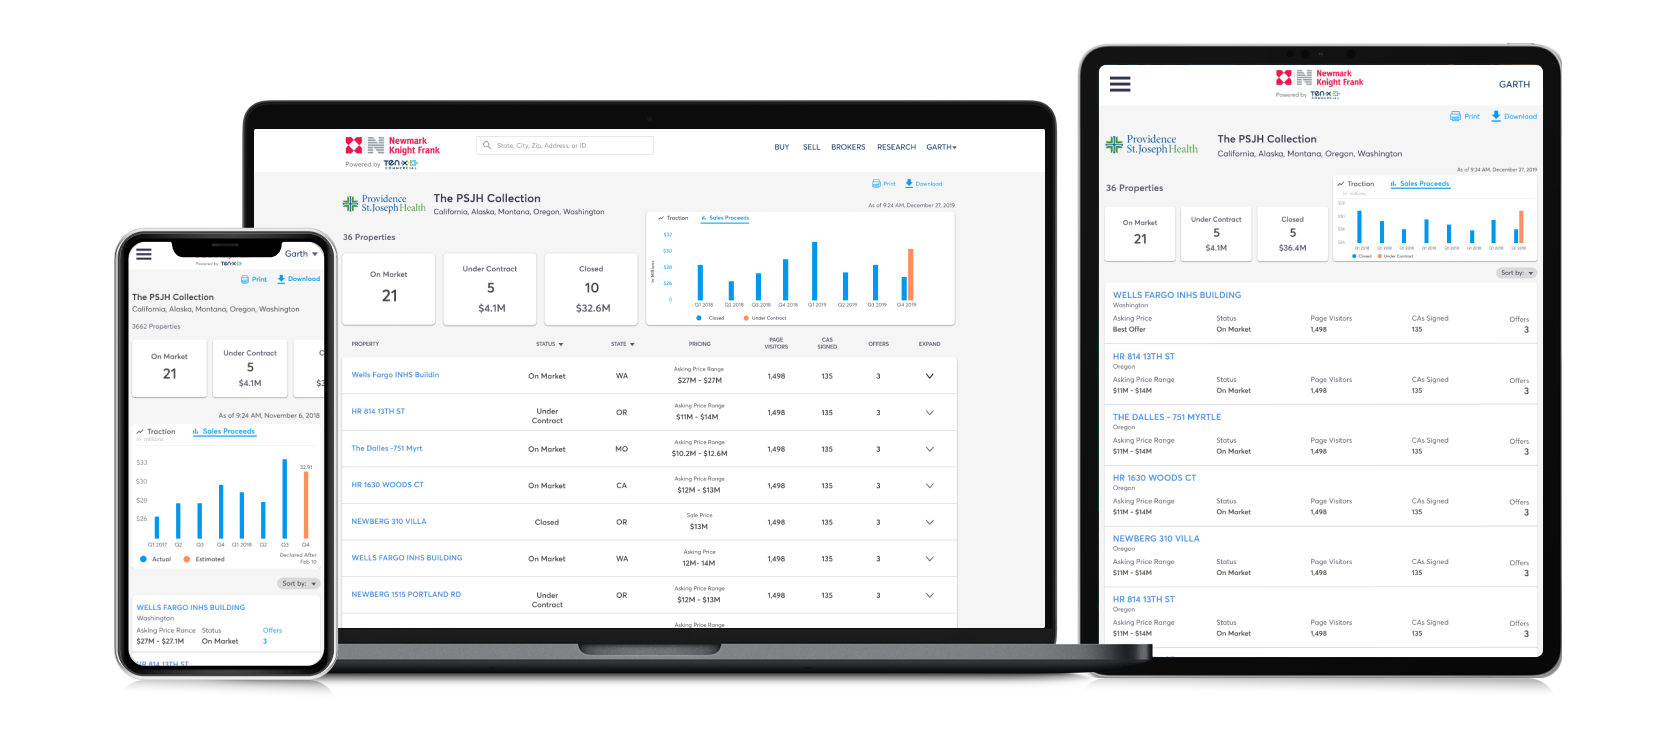
Responsive
The dashboard uses a responsive grid framework allowing data to be displayed on smartphones, tablets, and desktops.
Responsive Web App
Milestones

Plugged In
Successfully integrated on Ten-X and have served 4+ portfolios.

Adoption
Ten-X's strategic partners have adopted the new dashboard to track progress and report it to the sellers.

Foundation
The project laid the necessary framework for other projects such as buyer profile, private label, etc.

Transition
This was the first company project completely built on the Ant Design React framework paving the path for future projects.

